In the dynamic realm of the stock market, certain names stand out not merely as stocks, but as emblems of technological might and innovation. Microsoft Corporation (MSFT) and Alphabet Inc. (GOOGL), the tech behemoth behind Google, are two such luminary entities. Both have charted unique trajectories in the market, encapsulating tales of growth, challenges, and adaptability. As we delve deeper into an analysis of these two tech giants, we'll uncover the financial narratives, technical patterns, and the compelling reasons behind their sustained investor appeal. Join us as we embark on this analytical journey into the heart of MSFT and GOOGL stocks.
In the ever-evolving tapestry of the stock market, certain names frequently stand out, with Microsoft and Google being two such frontrunners this week. Here's an in-depth exploration of their current standing and future prospects.
Microsoft Corporation: An Analytical Deep Dive
Microsoft Corporation (MSFT), a household name in the tech industry, recently witnessed a dip in its share value by approximately 6% during the third quarter, settling at $319.90 (USD) as of 30 September. Mark your calendars, as the company is slated to unveil its earnings report for the fiscal quarter concluding September 2023 on Tuesday, 24 October, post-market closure. The anticipated consensus EPS stands at $2.65, marking a notable increment from last year's $2.35 for the corresponding period.
- Dividend Snapshot: Historically, dividend enthusiasts might have felt a tad underwhelmed with Microsoft, given its track record of maintaining a dividend yield below the 1% benchmark for the past four years. However, a glance at its financial robustness paints a different picture, making it hard to overlook.
- Financial Health: The company's financial statements are a testament to its resilience and sound fiscal planning. The assets-to-liabilities ratio boasts a comforting 2:1 figure. Additionally, the current ratio, at an impressive 178%, underscores Microsoft's capability to navigate through potential financial hiccups in the short term.
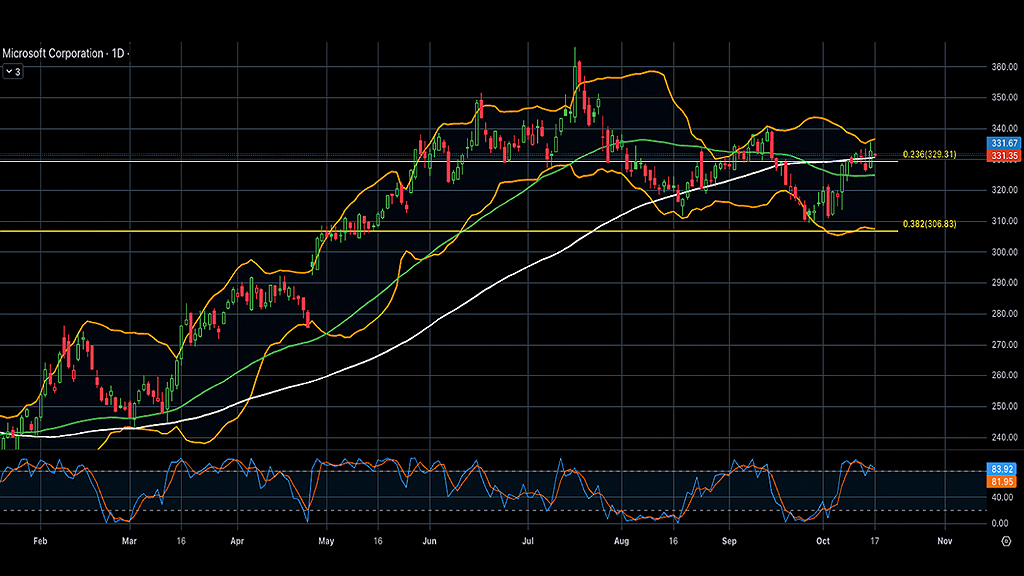
- Technical Analysis: Diving into the technical realm, recent trends suggest an upward correction for MSFT since the onset of October. This upswing found its foundation around the lower band of the Bollinger Bands. Currently, the stock is grappling with the resistance posed by the 23.6% level of the weekly Fibonacci retracement, coupled with the 100-day moving average. The Stochastic Oscillator treads into the overbought territory, hinting at potential downward corrections in upcoming sessions. Further validating this bearish sentiment is the fact that the faster moving average lags behind its slower counterpart.
- Future Outlook: That said, stock market dynamics are shaped by a myriad of factors, earnings being a primary one. Should Microsoft announce a robust earnings report later this month, the tables might turn, triggering a surge in bullish activity. This could catapult the stock price to uncharted territories or, at the very least, nudge it towards the recent high in the vicinity of the $340 mark.
Alphabet Inc.'s Strong Performance: A Closer Look
Alphabet Inc. (GOOGL), the tech behemoth behind Google, has seen its share price surge by a commendable 10% during the third quarter of this year. As the investment community waits with bated breath, the company is slated to unveil its earnings report for the fiscal quarter culminating in September 2023 on Tuesday, October 24. The forecasted EPS, according to market analysts, stands at an impressive $1.45, reflecting a significant climb from the $1.06 recorded during the same period a year ago.
Diving deeper into Alphabet's fiscal health, the company's debt has impressively slimmed down to its lowest since Q3 2020, accounting for a mere smidgen under 12%. This robust financial position is further emphasized by an enviable current ratio of 217% as of June 30, 2023. This figure accentuates the tech giant's prowess in comfortably addressing its short-term liabilities with the assets it currently holds. The ratio of total assets to total liabilities, standing tall at a staggering 3:1, paints a reassuring picture for stakeholders. Additionally, the company's net income witnessed an uptick of nearly 15% YoY during Q2 2023. Analyzing these metrics, it's hardly a surprise that Google continues to be a darling for both seasoned investors and day traders.
Technical Analysis Overview for GOOGL
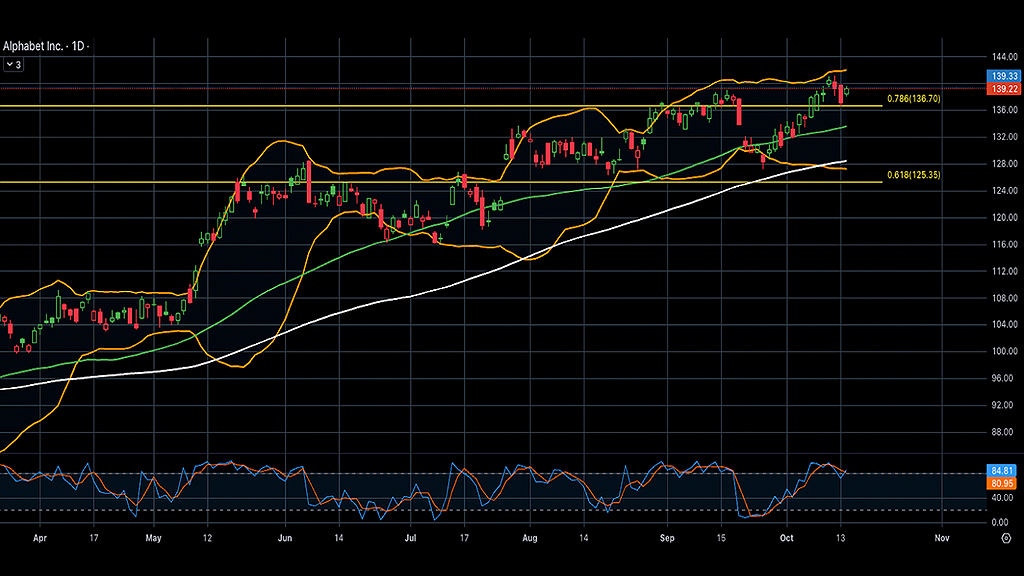
On the technical front, Alphabet's share price trajectory has predominantly exhibited bullish characteristics for a substantial chunk of the quarter, registering consistent advances. At present, the stock is trading well above key technical markers, including moving averages and Fibonacci levels, as it nudges closer to the prior peak of the $139-$140 bracket.
The 50-day moving average comfortably resides above the 100-day moving average, signaling sustained bullish impetus. However, offering a counterpoint to this optimistic narrative is the Stochastic Oscillator, which hovers in the extreme overbought territory. This suggests a potential downward correction might be on the horizon before the stock possibly resumes its broader bullish ascent.