McDonald's, the global fast-food giant, experienced a notable uptrend from mid-October to early January, marking an impressive 20% increase from its low of 245.51 to a high of 297.73. However, despite this robust bullish sentiment, McDonald's stock failed to surpass its July record high of 299.10, leading to a period of consolidation. The current concern lies in the short-term price action, which appears to be forming a potentially bearish head and shoulders pattern. If this pattern is confirmed by a break below the neckline region spanning from 287.50 to 285.38, it could trigger a rapid decline towards the 38.2% Fibonacci retracement level of the previous uptrend, situated at 277.74. Notably, this level coincides with the presence of the 200-day exponential moving average (EMA). If sellers manage to breach this support level, the downtrend might intensify, targeting the 50% Fibonacci retracement level at 271.56.
The technical indicators further highlight the waning bullish pressures. The Relative Strength Index (RSI) is showing signs of extending its downtrend below the 50 neutral mark, while the Moving Average Convergence Divergence (MACD) continues to decelerate below its red signal line.
Nonetheless, there remains a possibility of a rebound near the 20-day EMA, currently at 291.23, which has provided a protective barrier in recent sessions. Such a rebound could initiate another attempt to break through the resistance zone between 297.73 and 299.10. A successful breach of this area might encounter further resistance near the lower boundary of the previously broken bullish channel, approximately at 303.80. Subsequently, if the bulls manage to surpass this barrier, attention will shift to the long-term ascending trendline at 313.25, connecting all the highs since 2019. Additionally, the upper boundary of the channel, situated at 315.30, could represent another critical region to monitor.
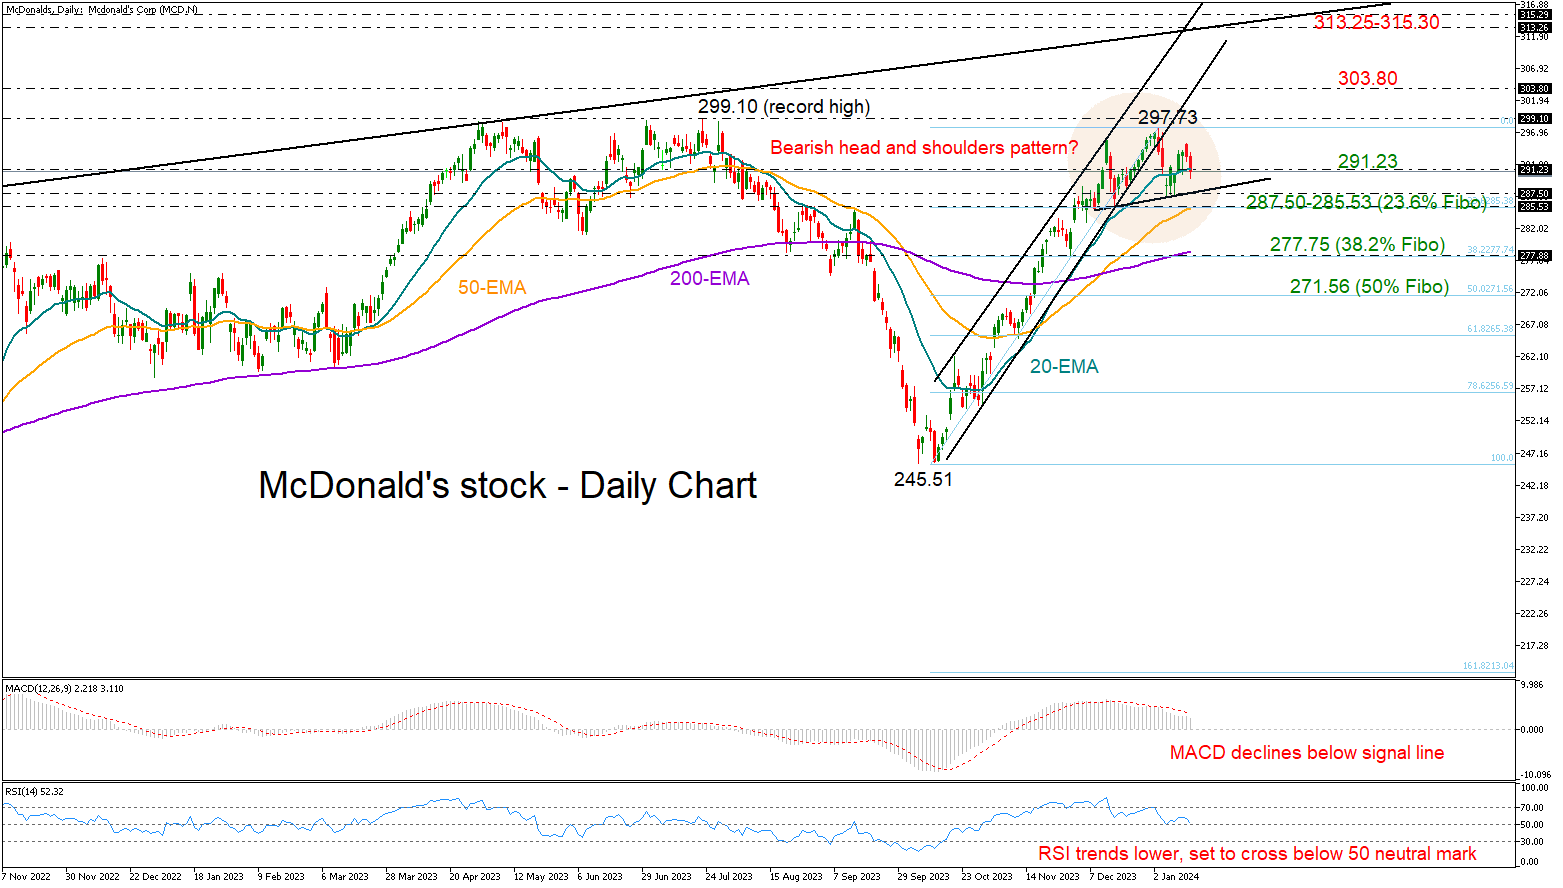
In summary, the technical analysis suggests that McDonald's stock may be poised for a potential bearish phase, with confirmation likely to occur upon a break below the 287.50-285.38 support area. Traders and investors should closely monitor these key levels and patterns to assess the stock's future direction.