Recent developments in the US stock market suggest a shift in investor sentiment, fuelled in part by evolving stances from the Federal Reserve (Fed). With the major US indices showing significant positive movement, many analysts speculate we may be seeing the tail-end of the ongoing market correction.
Federal Reserve's Role in the Market Dynamics
A substantial motivator behind the recent rally of US indices was the revised tone of the Federal Reserve's comments. Over the past week, numerous members of the Federal Open Market Committee (FOMC) have hinted that aggressive policy tightening might be off the table, a notable departure from previous indications.
This change in stance seems to be the Fed's response to the accelerated surge in long-term bond yields. Historically, since 2007, the Fed's tone has largely been influenced by volatilities in the equity markets. This recent shift, which is driven by dynamics in the debt markets, signifies a novel approach by the Fed. Current market forecasts suggest a decreased likelihood of a rate hike this year, with the odds dropping from 47% to 27% within a week.
Technical Analysis Indicates a Turnaround
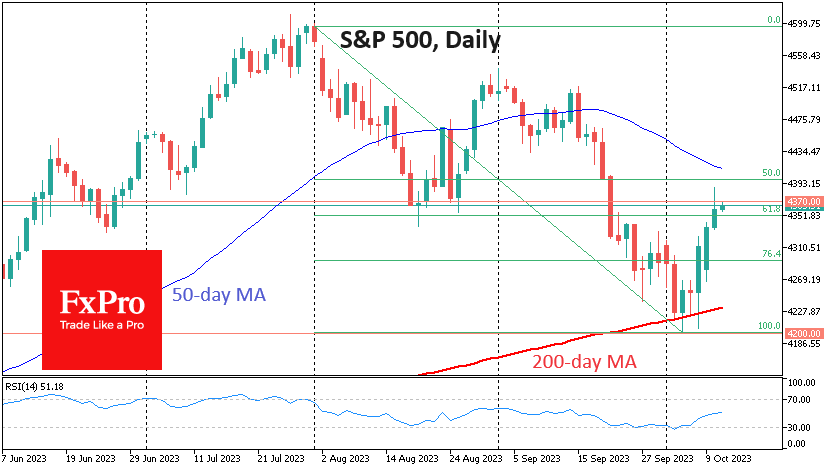
From a technical perspective, the US indices are showing promising signs. The S&P 500, for example, has consistently found support when dipping towards the 200-day moving average during the early trading days of October. Last Friday's attempt to drive the prices lower did not sustain, with the index rallying by an impressive 2.8% within just six hours.
Furthermore, the market witnessed expansion on both Monday and Tuesday, hinting at the possible conclusion of the two-month correction phase after approaching a pivotal support level. Notably, the S&P 500 wrapped up Tuesday's session above 61.8% of its downside range from early August to 4th October.
Historically, October has set the stage for a robust year-end, suggesting that seasonality might further bolster bullish sentiments.
A Closer Look at the Indices
The Nasdaq-100 Index has mirrored the enthusiasm of the S&P 500, rising above its 50-day moving average, showcasing bullish momentum. For a more concrete affirmation that we've passed the correction phase, investors are looking for a set of signals: The S&P 500 Index has approached the 4370 mark, a significant support zone in August, which could now act as a resistance. Despite the Nasdaq-100's descent in early October, a surge beyond the 15400 level would hint at a trend reversal.
The Dow Jones 30, which found support below the 33000 level in its downward journey (similar to its pattern in May), is now challenging the 200-day moving average at 33850. A stable move above the 34000 level would be a robust indicator of a return to a long-term upward trend and potentially mark the end of the correction.
In conclusion, while the market showcases promising signs, prudent investors are still awaiting further confirmations before decisively concluding the end of the correction.