


It is extremely important for any trader to correctly determine the direction and strength of the trend movement. Unfortunately, the only true solution to this problem is missing. Many market participants trade at various time intervals. For this reason, the received signals are perceived subjectively.
Trend indicators provide an opportunity to classify the direction of price movement, determining its strength. The solution to this problem helps investors to enter the market on time and make good profits.
Technical Analysis Tools
Technical analysis of the Forex market is described as various methods of its research, which make it possible to predict the price movements of assets. In this case, the historical data of the analyzed asset are necessarily taken into account. It is the correct execution of such actions that helps traders in time to make the right decision and get profit.
Technical Analysis Components:
- Graphic figures;
- Indicators;
- Price levels;
- Japanese candles.
It is these tools that make it possible to effectively predict the market. Since in manual mode this process takes a lot of time, and traders often have to make decisions promptly, the most popular means of price research are forex trend indicators.
Classification of indicators
A wide variety of these tools is divided into several groups depending on what tasks they are called to solve.
General categories of indicators:
- Forex trend indicators help to analyze the market for the selected time interval. They determine the dominating trend and are used in trading with this trend;
- Turn indicators are part of the above instrument category. They not only analyze the price movement, but also indicate the points of possible reversals. This contributes to the quick and optimal opening of buy or sell orders (depending on the current situation);
- Indicators of the construction of channels and levels. Quickly identify support and resistance lines. Thus, the trader is guided in the intended price range, having the opportunity to open the trading position in time and close it in time;
- Tools that analyze the main Forex parameters help to obtain information on the current volumes of all market transactions for a particular asset.
RSI indicator
Relative Strength Index – this is the exact name of this Trend indicator. It is applicable in many trading systems and in any markets. A tool is an oscillator that changes in a specific zone with maximum and minimum restrictions. RSI values ​​can vary from 0 to 100.
When the indicator line moves in the corridor from 70 to 100 on the chart of a traded asset, the market is considered to be in an overbought state. If there is movement in the range from 0 to 30, this is an oversold state. RSI can warn of a trend reversal, its strength and price approaching the center line.
The oscillator is calculated according to the formula RSI = 100 - 100 / (1 + RS). Here, the RS component is the ratio of the average growth of an asset to its average fall. The relative strength index is determined on the basis of 14 time intervals. This is the recommended standard number of periods.
In relation to the candlestick chart, the tool compares the average gain with the average loss, analyzing the last 14 bars. This takes into account the size of each candle.
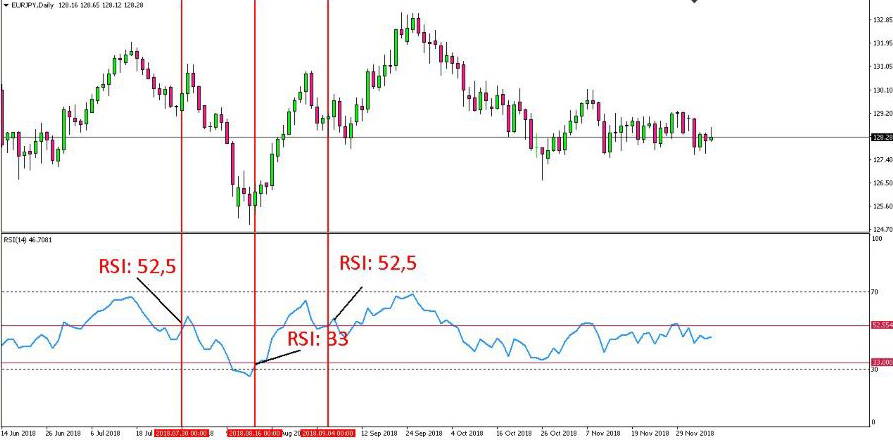
In the figure, one can observe how the relative strength index is calculated. In the first selected area, the RSI value decreases from 52.5 to 33. In the second area, the index value increased to 52.5. Analysis of both sites was made by the indicator based on 14 candles. The indicator makes these calculations much faster than the manual method.
MACD Algorithm
The method of convergence-divergence of moving averages is the literal translation of the described trend indicator. It is also an oscillator which is located under the asset chart and displays the difference between the exponential moving averages of a smaller and a larger time period. By default, their periods are 12 and 26. Fast moving displays a short-term trend, the slow one – on the contrary, longer in time.
There are two types of algorithms – linear and histogram. The second is the difference between the signal line and the indicator. It is calculated by the formula MACD Histogram = MACD - Signal.
It can be observed under the asset graph in the form of columns. The histogram shows the direction and strength of the current trend.
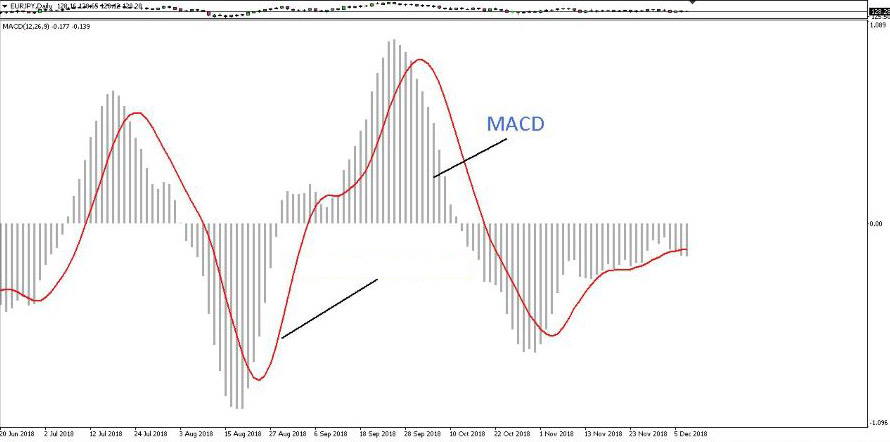
The line tool looks like a moving average with a period of 9. This is a red line in the chart. It is a market with a wide spectrum of fluctuations that will enable the MACD to fully express itself. A clearly defined trend contributes to the fact that the indicator receives the correct signals.
The signals coming from the indicator can be interpreted in different ways.
The intersection of the oscillator bars of the zero level. When this happens from top to bottom it’s a sell signal, from bottom up – a buy signal;
MACD crosses the fast (signal) line from the bottom up in the time of purchase, a cross from top to bottom indicates the sale of an asset. The trend is determined by well-known rules which is the presence of local extremes;
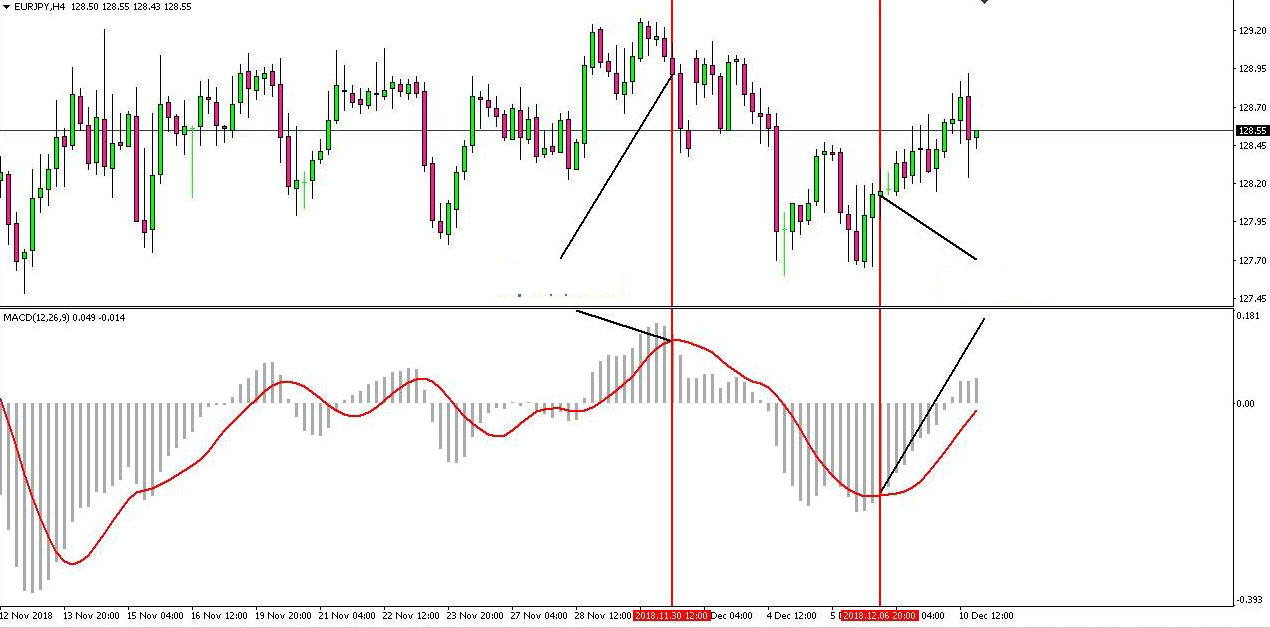
Divergence - a discrepancy between the instrument and the price on the chart. A trend reversal is possible. This is clearly seen in the figure below.
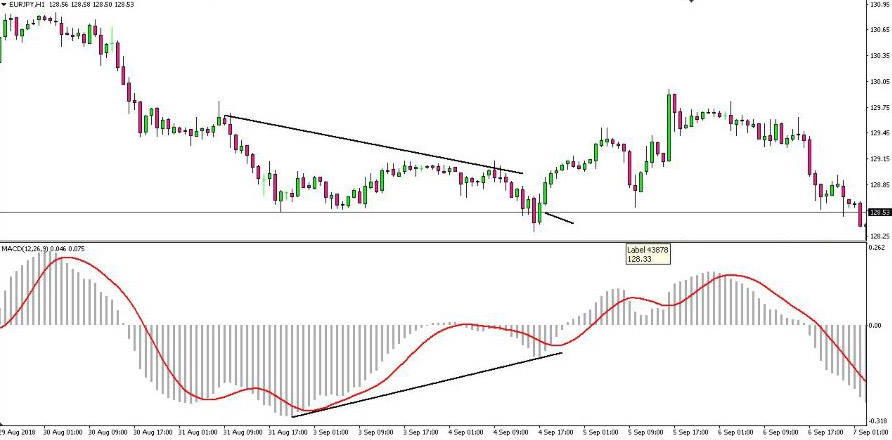
After the divergence, the downtrend of the EURJPY pair became upward.
The histogram of the tool also helps to identify typical graphic patterns. Among them are “head-shoulders”, “double top”, “double bottom”, etc.
Professional traders evaluate MACD as a tool that combines elements of momentum and trend assessment. While moving averages provide trend control, it is precisely the analysis of the difference between them that will not miss the moment of a reversal.
Stochastic oscillator
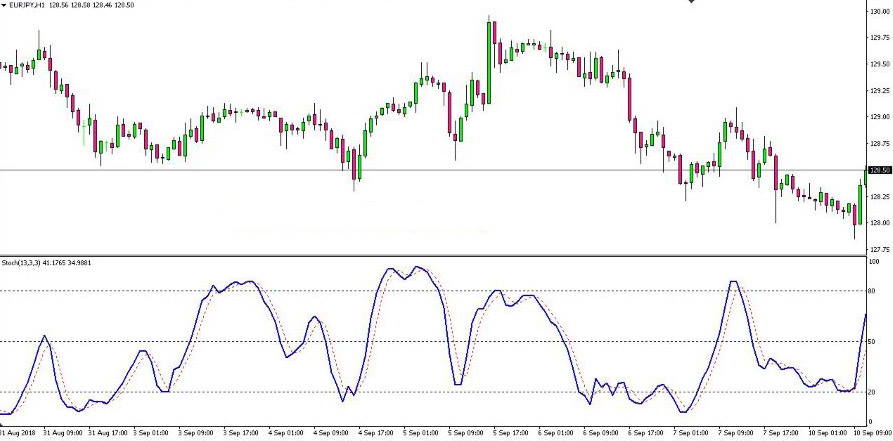
Among the best indicators of the trend on Forex, we can safely highlight the stochastic oscillator, often referred to as "stochastic." It determines the rate of price change or price momentum. The tool analyzes the market speed, determining the position of closing prices in the range between the maximum and minimum values. The calculation is made for a specific number of days.
More precisely, the “stochastic” as a percentage from 0 to 100 shows the ratio between the closing price and the range between the minimum and maximum. The allocated zones are from 0 to 30 (oversold), from 70 to 100 (overbought). Depending on the nature of trading, you can change them.
Stochastic works best on wide price ranges. It is successfully used on soft trends that have a slight bias down or the same rise up. The indicator does not give the desired results with a stable trend with minor corrective movements.
There are two ways of functioning of this indicator:
- Fast. It is more accurate, but its disadvantages are excessive sensitivity to various noises and a large number of false signals;
- Slow. It is more smooth but the number of supplied signals is less than in the first embodiment.
For the correct setting of "stochastic" there are two indicators:
- % K - the period corresponding to the work of fast Stochastic. Despite the fact that the default value is initially set to 3, they still recommend 13. On the chart, it is displayed as a solid line in blue;
- % D - the slowed down period. The red signal line looks smoother. If the values ​​are increased, false signals will be filtered.
In addition to these settings, there are additional ones that can be changed at the request of the trader: deceleration, prices, MA method.
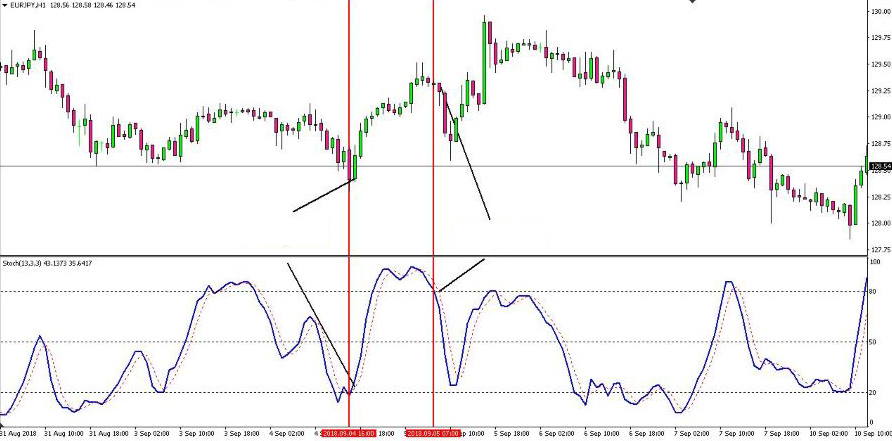
Stochastic is successfully used for the following methods: scalping, trading in the price range, trading for breakdown and trading with the trend. A convenient moment to enter a long position is when in the oversold zone the red line is crossed by the blue one, from the bottom up. Activation of a short position is carried out when in the overbought range the blue curve crosses the red from top to bottom.
MA tool
It is one of the most popular trend indicators. In a trading environment, it is often referred to as a “moving”. Moving Average is the full name of the instrument which is one of the most commonly used Forex indicators. It is a component and addition of more complex algorithms in one form or another.
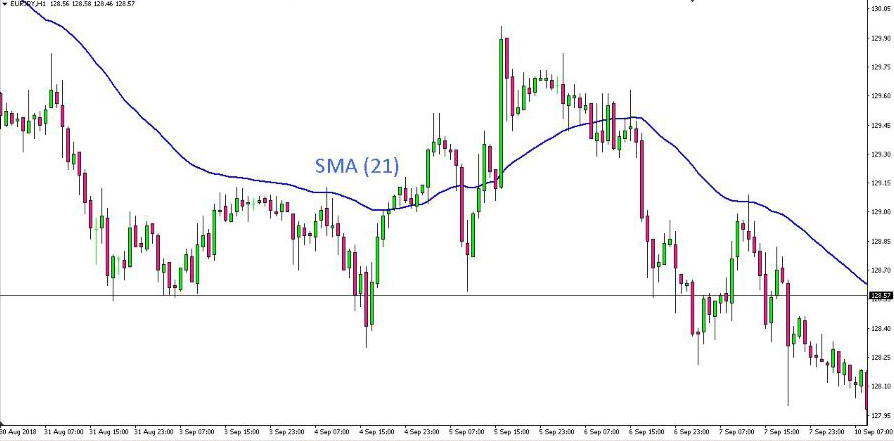
"Moving" is intended to determine the average price value for a selected period of time. There are several types of Moving Average:
SMA - Simple Moving Average. The algorithm displays the average price for the selected time period. When MetaTrader is set to 10 (instrument settings), the algorithm will calculate the sum of the last 10 closing and opening prices, which is divided by the number of selected periods;
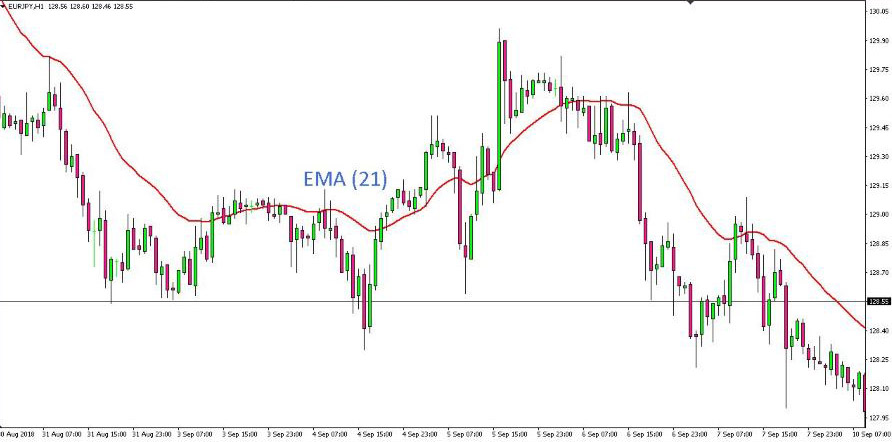
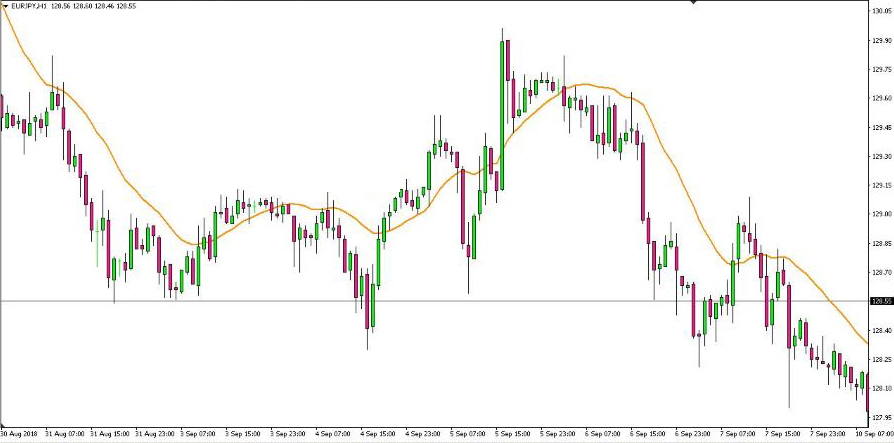
EMA - Exponential Moving Average. It was created to reduce SMA latency. The calculation takes into account the fact that new prices have more priority than old ones. The advantage of EMA lies not only in smoothing the price, but also in quick response to its change. Therefore, the indicator is often used for intraday trading;
WMA - Weighted Moving Average. Being a trend indicator, it removes some of the shortcomings of a simple moving one, making the delays in entering the market much less. The latest price values are given more weight. The tool is faster than its predecessor, responds to market changes.
Beginners of trading should remember that, using a set of forecasting tools, it is advisable to choose 2-3 indicators for trading. Otherwise, their abundance on the chart of the selected asset will mislead the novice trader.


