No doubt support and resistance levels are one of the most important elements of technical analysis. Any trader agrees with this statement. Some traders use levels directly, opening and closing orders at the borders of the range outlined by them. Other traders apply supply and demand balances in their trading strategies at various time intervals.
The visual representation of the boundaries of the struggle zones between sellers and buyers is very convenient and serves as an excellent guide for all market participants. The problem of automatic drawing of support and resistance is solved by level indicators.
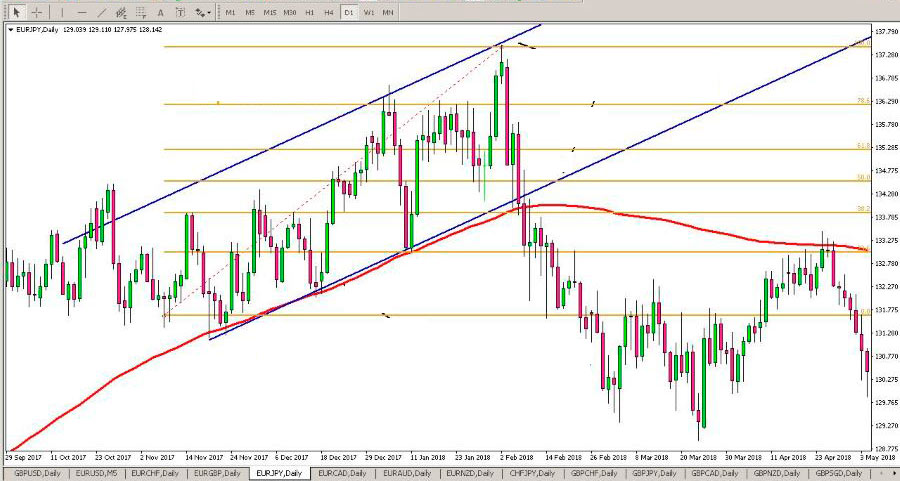
Representation of support and resistance in the trading terminal
In MetaTrader trading platform several forms of displaying the above levels already exist. The most common tools are:
- parallel straight lines representing the channel in which the price change occurs
- moving averages with various long periods. The numerical value of periods, as a rule, starts from 100 and is a round number
- Fibonacci levels are a great way to determine price pullbacks. This technique can be applied on any timeframes
The above three tools are based on many trading methods used on Forex. To use special zones with maximum effect, special algorithms have been created - indicators of support and resistance levels. Their diversity allows a trader to choose the indicator most suitable for him to receive a profit from trading.
Zone indicator
This is one of the most common and effective algorithms designed to determine strong horizontal levels. Although Zone is not included in the standard MetaTrader4 toolkit, it can be easily found on the Internet and installed in your trading terminal.
Two parameters deserve special attention:
- TF - the time interval at which the instrument draws important horizontal levels. This value is set in minutes. From 1 minute for M1 to 43299 minutes for a monthly period of M;
- Maxbars - the number of bars used to build the boundaries of support and resistance. By default, it is equal to 1000. If there are other indicators used in the trade, you can lower the Maxbars value so as not to load the trading terminal.
In addition to the above settings in the indicator, you can change the thickness and color of lines, font size. The use of Zone in trading should be similar to other Forex levels indicators. In case of a turn from the intended borders - use the moment to enter the corresponding position - long or short. The option of breakdown levels is to trade using the appropriate strategy.
Unlike other similar algorithms, Zone reflects the most important levels in the terminal, from which, with a high degree of probability, the price will push off. Significant volumes were traded near these borders. You can use this tool in trading on your own or together with other indicators confirming the market reaction at the estimated time of sales or purchases.
Before applying the Zone algorithm in real trading, you should test it on a demo account by selecting the appropriate settings. Only after making sure that the indicator works correctly, you can start trading with real money.
Some experienced traders suggest applying a Zone with various Time-Frame settings to the chart of the selected asset. Then you will see a clear picture of the reversal levels of all-time intervals. This will serve as an additional filter for entering the market.
PowerDynamiteAreas Indicator
This is a pretty good and intuitive Forex indicator of resistance and support levels. PDA is used by both novice traders and experienced ones. The tool makes it possible to visually observe the levels differentiated by their strength on the terminal screen. Moreover, such a picture is displayed on any timeframe.
Finding and installing a PDA will not take long. Among the input parameters, the most important can be distinguished:
- Pivot Strength - adjust the strength of the level. Varies from 1 to 7;
- Max Look Back Bars - displays the number of candles used for calculations;
- Max Levels - the number of support and resistance levels simultaneously displayed on the terminal screen.
In addition, it is possible to change the thickness of the lines and the distance separating two adjacent horizontal levels in the settings. You can use PDA by its own and as an additional filter with other indicators to confirm a convenient moment to enter the transaction.
In the first case, there are three scenarios:
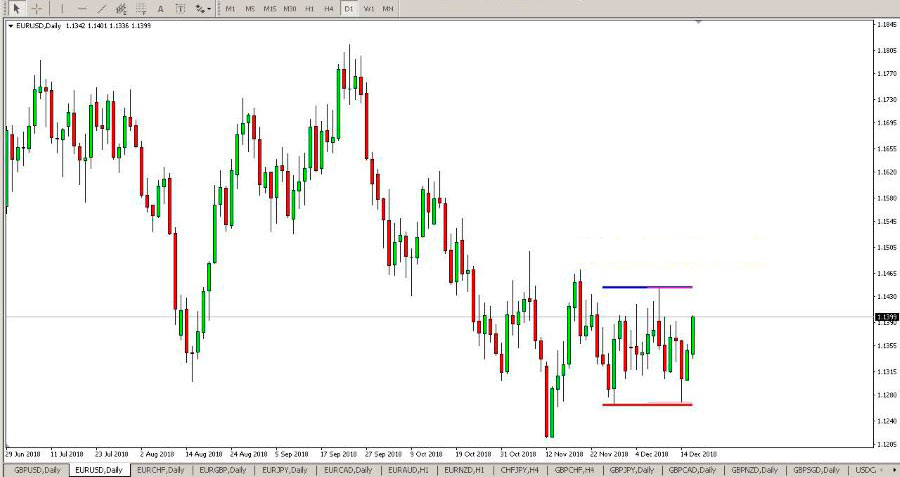
- Opening a position when the price bounces off the level. After analyzing the trend movement, the trader should wait for the price to bounce off the line drawn by the indicator and open a buy (sell) order. Take profit and safety stop loss are set in a 3:1 ratio. This is the minimum ratio for trading on the asset hourly chart.
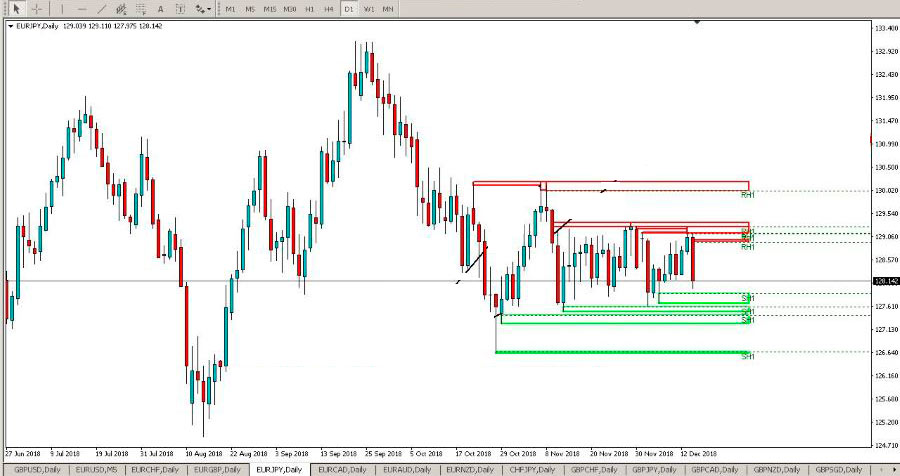
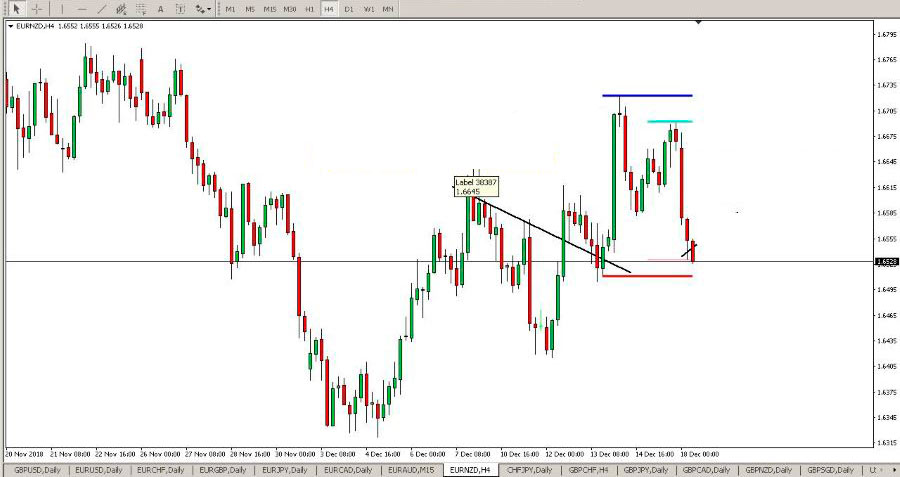
- Opening a position after a breakdown of a level. This option provides for market entry if the situation develops as follows. After breaking through the level and then fixing it, the price re-crosses this border in the same direction, as shown in the figure below. The end of the candle will be a signal to open a position. A safety order is placed for the last extreme. An open position can be accompanied by a trailing stop or, over time, move the stop loss to breakeven and gradually shift it after the price.
- Trading in the lateral price range. In this case, the PDA tool clearly draws the lines of struggle between sellers and buyers. The price changes in the designated corridor. It is necessary to wait for the appearance of a candle with a medium or long beam near the border directed in its direction (as shown in the figure). After the final formation of the candle, you should enter a long or short position, placing a stop loss per level.
The undeniable advantage of the PDA is that a novice trader cannot doubt the accurate visualization of significant levels of support and resistance by an indicator. Using this unique tool for intraday trading, the trader receives a good filter of signals warning him about the advisability of not entering the market in front of a strong obstacle. Of course, you should take into account the most important news events in trading, after which the price can break through significant levels and go further.
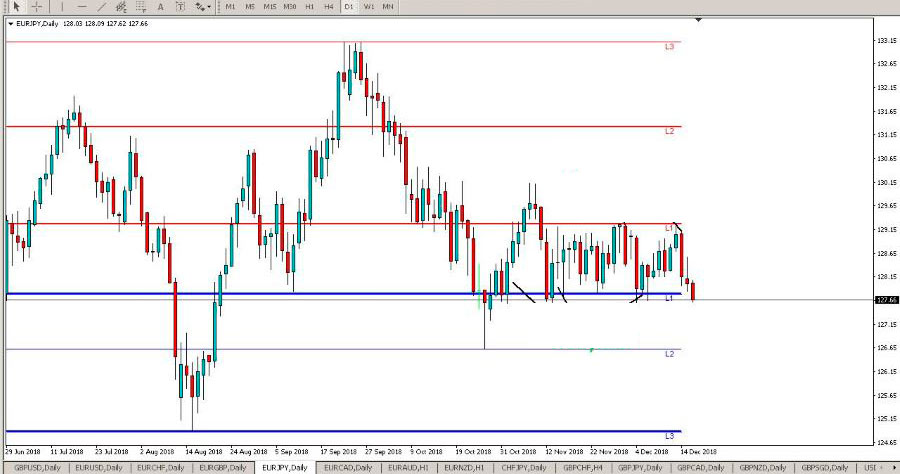
Lines Algorithm
It is one of the simplest indicators of support and resistance levels without redrawing for intraday trading. The peculiarity of the algorithm is that it displays two resistance lines and two support lines on the chart of a traded asset.
All lines are painted in different colors and have different thicknesses. Differences mean significance levels:
- red support and blue resistance are more significant levels;
- pink support and cyan resistance are secondary boundaries.
Significant levels exceed secondary levels in extent. This is clearly seen in the figure.
In the Lines settings, parameters for more significant boundaries are provided - X1, Y1, L1, L2. For secondary - X2, Y2, L3, L4.
They are displayed in the Tool Settings window. X values ​​specify the length of the time interval at which price levels are calculated. The parameters Y are responsible for the width of the stripes plotted on the graph.
Visualization on the screen of 4 levels determines the specifics of using Lines. Traders who have used this tool in their trading recommend changing their settlement period with a certain time interval. Thus, you can track the change in position of the levels.
If this position does not change for a long time, then the price moves in the channel. Therefore, it is advisable to use a strategy of rebound from price levels, opening buy and sell orders. It is very comfortable. The main thing is to open short and long positions on time. You can use the tactics of pending orders.
In case of breaking through important price levels - apply the appropriate trading method. Also use pending orders.
PZ levels
PZ is another indicator of levels identifying their importance. It is not easy for a novice trader to manually draw important and less significant price boundaries on the chart. Their diversity is explained by the fact that the information provided by various analytical agencies is perceived differently.
The PZ indicator evaluates each level and, depending on the importance, displays it on a chart with a certain thickness. Individual, not yet formed, borders are displayed as a dashed line.
The algorithm has several advantages:
- simultaneous analysis at four time intervals
- price behavior is analyzed near the formed extreme point. The nature of its movement (slow, fast) is revealed. This is the strength of the supply and demand zone
- combining fairly closely spaced levels into one
- the ability to configure instrument parameters for your trading system
- lack of redrawing and the possibility of sound alerts
All PZ parameters are divided into three categories - affecting the results of the analysis, tuning and displaying the results - visualization, notification options - phone, email, sound. The indicator is easily downloaded and installed in the trading terminal.
Traders who have applied the PZ algorithm in practice advise to use it in trading to hang up from levels. Quite effectively, it works out in channel strategies. A signal for a reversal may be candlestick patterns.
Many level indicators are similar to each other according to the principle of operation and perform the same functions. Although each of them has its own individual characteristics. Therefore, each trader chooses indicators individually, having previously tested them in practice.