


The estimated trading volume of the foreign exchange (Forex) market stands at $6.6 trillion, a figure that exceeds even the volume traded across all stock markets. That is one of the primary reasons why the profit-seekers are flocking to Forex day after day. But the statistics have it that the overwhelming majority of traders are losing money. Obviously, that happens due to the lack of time-tested Forex trading strategy and money management skills. The year 2020 has proven to be tough on Forex and all other financial markets, but it has also given an opportunity to revise many trading systems and approaches and come up with a list of the best Forex strategies for 2021 that have proven their efficiency even at such turbulent times.
VWAP - a solid foundation for an intraday trading strategy
VWAP stands for the volume-weighted average price - it’s an indicator that we deem to be superior to many other charting tools because it takes into account both the trading volume and the price of a currency. It is calculated by multiplying the sum of price by trading volume and then dividing that number by total volume.
The inclusion of volume in calculations is the trait that makes VWAP a very powerful indicator - and in our opinion, often underused - alternative to the 9-day and 25-day moving averages since VWAP is considerably slower, thus providing far less false Forex trading signals. The indicator’s other significant feature is that it’s often used as a guiding landmark for big market players like institutions and pension funds, whereas retail traders often disregard VWAP when devising the intraday Forex trading strategy while focusing on popular indicators that often lead them astray.
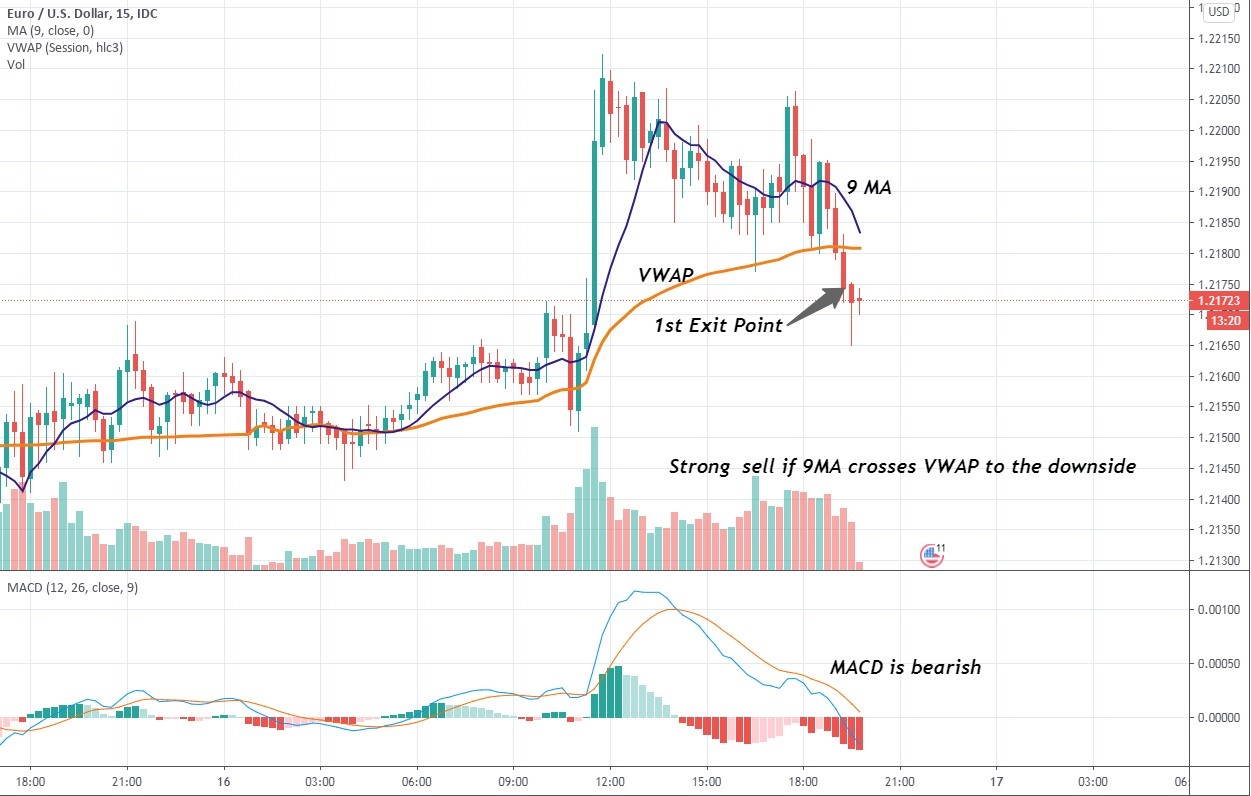
15M EUR/USD chart
The rule of thumb for using VWAP is rather simple: a trader must give preference to long trades when the price action occurs above the indicator and consider taking short trades when the price dives below the line. But remember that it should be included in the currency trading strategy only for a single day of trading as it reboots every day prior to the market open, so avoid building the mid-term, and especially long-term trading strategies on Forex, on the basis of VWAP showings.
However, VWAP works best when used in combination with the actual volume indicator, the 9-period moving average, and a momentum oscillator like MACD since they provide sufficient confirmation for entering a trade. The EUR/USD chart above provides an example of how the Forex strategy that incorporates VWAP can be applied. Here we see the price dropping below 9MA and VWAP, signifying a strong selling pressure, which is confirmed by the bearish MACD and the mounting bearish volume. According to this trading strategy, you should make the first sell at 1.2175 and keep on selling if 9MA dives below VWAP, a move that is called the VWAP cross.
Support/Resistance and two Stochastics - a powerful combo for successful Forex trading
Trading Forex using support and resistance (S/R) zones is probably the oldest play in the book. Nevertheless, they remain one of the most efficient tools for building profitable Forex strategies around. We are ce draw these lines rather frivolously, which ultimately leads to losing trades. rtain that there’s no need to teach you the basics of finding and plotting the lines of support and resistance, but we will give you some tips since many traders - even some seasoned ones - tend to
- Always consider the trading volume when plotting S/R lines. The price action zones on the charts that saw the largest volume spikes should always be taken into consideration as they indicate the areas of increased supply or demand;
- Remember that the horizontal support is considered more reliable than the diagonal one, especially when it comes to determining the pivot points.
- When determining S/R for your trading strategy, remember to start from the macro time frames (monthly, weekly) and gradually move down to the lower ones.
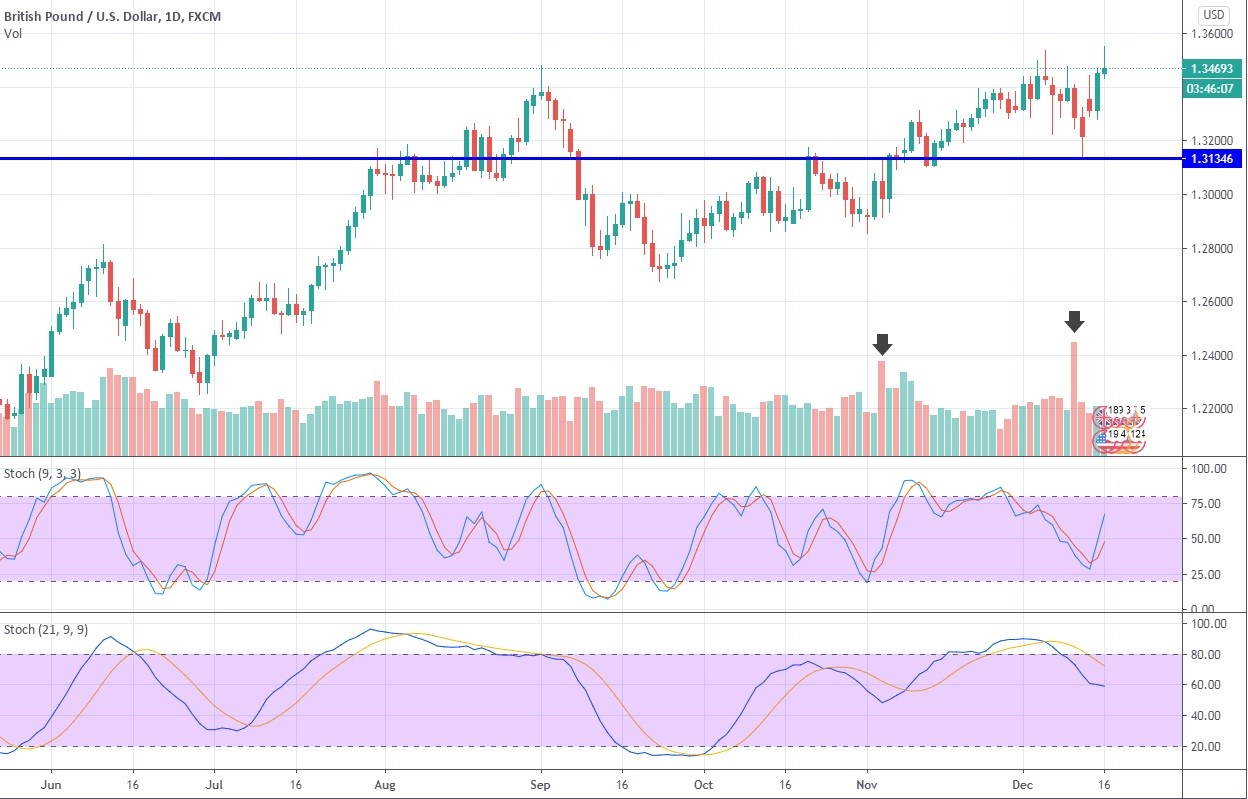
1D GBP/USD
For this Forex trading strategy, we will employ horizontal support and resistance, combined with two Stochastics: the fast one, set at 9-3-3, and the slower version of the same indicator with the settings of 21-9-9. The idea behind this strategy is the following: determine a strong S/R level by analyzing the trading volume and then use the showings of Stochastics to determine the immediate and mid-term momentum and plan the trades accordingly. In this example, the fast Stochastic is bullish while the slow one is obviously bearish, so we might be looking at a spike to 1.369, followed by the pullback to 1.313. For this currency trading strategy, it’s immensely important to understand where the momentum is taking the price when it approaches the area of intense price interaction, as it hints at whether the S/R line would be able to hold.
Employing Parabolic SAR and MACD to maximize the profits
The Forex strategy that utilizes the Parabolic SAR and MACD is fairly simple and applicable to all timeframes higher than 15M, and to many currency markets. Besides, these two indicators are available on all Forex trading platforms for free, thus making it even more useful. It comes to show that your strategy doesn’t have to be overly complicated in order to be profitable. Oversaturating your strategy with complex trading tolls would oftentimes result in total discordance. At the same time, throwing SAR and MACD on top of candlesticks would keep the chart clean while providing enough signals for successful trading on Forex.
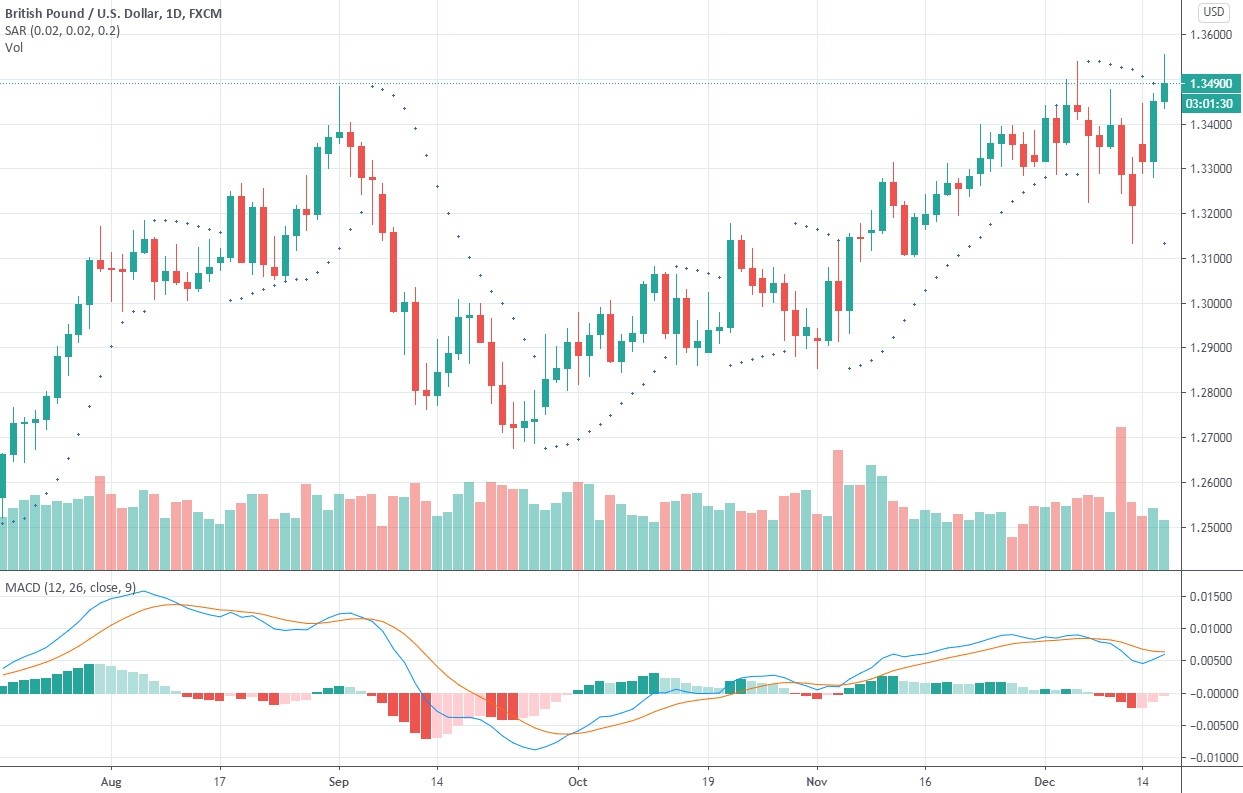
1D GBP/USD chart
Please keep in mind that the SAR/MACD Forex strategy works best only in trending markets, whereas its efficiency tends to decrease when the price gets into the range since SAR is the trending indicator.
In our experience, EUR/USD and GBP/USD are the most suitable markets for this strategy since they are more volatile than some low-volume exotic pairs. In this instance, the MACD settings should be 12- 26-9, while the Parabolic SAR must be set at 0,02 -2.
According to this strategy, a trader should go long when the dots of Parabolic SAR are located below the price action while the MACD is crossing the zero line to the upside while three SAR dots are forming. If the SAR dots have already appeared while MACD is still below the zero line, such a signal should be considered false. For short trades, the Parabolic must be above the forming candlesticks while MACD should be crossing the zero line to the downside.
Grid trading on Forex
Arranging the buy/sell order in a grid with equal intervals has long been considered as one of the best Forex strategies, as well as a universal one since it can be applied to trading currencies on all timeframes and in both trending and ranging markets. The gist of this approach to trading is also rather simple. A trader has to place the corresponding orders above and below the predetermined price level at the same distance, ultimately creating a grid of orders, hence the name of the Forex trading strategy.
For instance, you can start the grid by placing the corresponding orders 20 pips higher for buy orders and 20 pips lower the set price for sell orders in the trending market conditions. This Forex strategy is also applicable to ranging markets, but in that case, a trader should set the buy orders underneath the price level - the buy order will go above the said zone.
The best thing about this method is that it rarely requires an extensive analysis of where a particular Forex market is going, making it one of the most automatable strategies of average complexity. Grid trading allows market participants to increase the position size while the market is either trending or ranging. But beware that this approach to Forex trading is most effective when the price is moving in a sustained direction. If the price action is volatile and choppy, it might travel up and down between the grid levels, while the trader incurs losses due to price hitting orders on both sides. That’s why it’s advisable to limit the grid to several orders; otherwise, it would require less position management and help mitigate the risks.
Monday open - trade Forex one day a week
Littering the trading panel with indicators might make a Forex trader look smart, but it would definitely do more harm than good for his performance since most of these tools are lagging and flashing false signals. However, there is a Forex strategy for positional trading that requires no indicators as it uses only a clear bar or candlestick chart. This method relieves traders of the necessity to stare at the screen throughout the weekdays as it implies the execution of one or a few trades a week on Monday, shortly after the market opens. Understandably, this strategy is suitable only for the daily time frame, and it probably works best in the EUR/USD market.
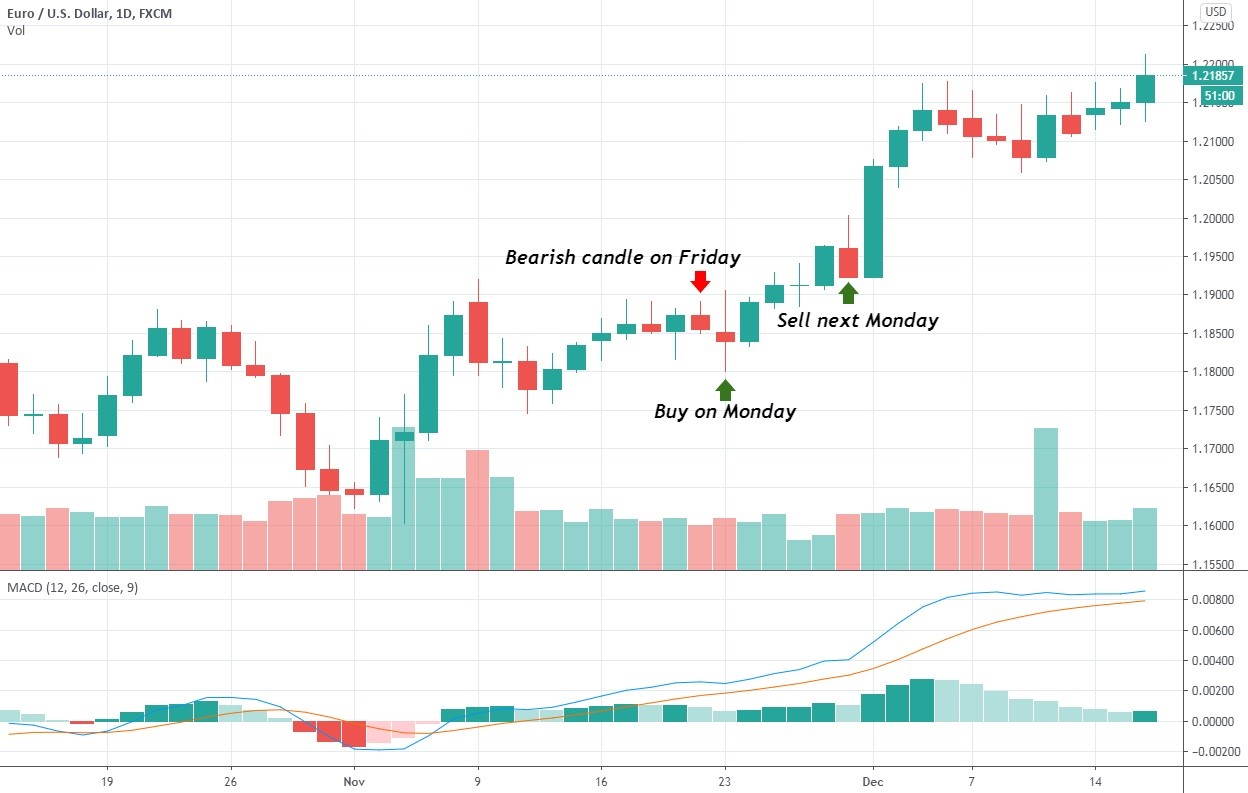
1D EUR/USD chart
The concept behind this strategy for trading on Forex isn’t that complicated: on Monday, approximately 15 minutes after the market gets busy (this time interval is required to normalize the spreads), a trader should open the position in the direction opposite to the candlestick from last Friday. For example, if a trader had taken a long position on Monday in the EUR/USD market (as shown on the chart above), he or she would have scooped a profit of 125 to 205 pips the next Monday. For this strategy, use the highs or the lows of the last week’s candle to set up the stop-loss, but make sure that it’s located no closer than 30 pips and no further than 50 pips away from the buy/sell area, depending on the present volatility in the market. Also, this currency trading strategy requires meticulous money management and position sizing. Refrain from entering a trade if the market is in a state of uncertainty, which could come in the form of a candle with a small body and large wicks.
The Forex strategy built upon momentum oscillators and Bollinger Bands
Volatility is one of the key characteristics of the foreign exchange market. It causes large price swings during which time a trader must seize an opportunity for profit-making when the price is pulling back or reversing after a strong impulse to the upside or the downside. Apart from the Average True Range (ATR) indicator, Bollinger Bands (BBs) are the most reliable tool for gauging market volatility. The basic principle of trading Forex with BBs is simple: the expansion of the bands signals that the price action in the particular currency pair is growing increasingly volatile, whereas the contraction of the bands occurs during the consolidation period when the price is in the range. There is also the Bollinger Bands squeeze, the period when the bands are drawn very close to each other that usually precedes large price swings.
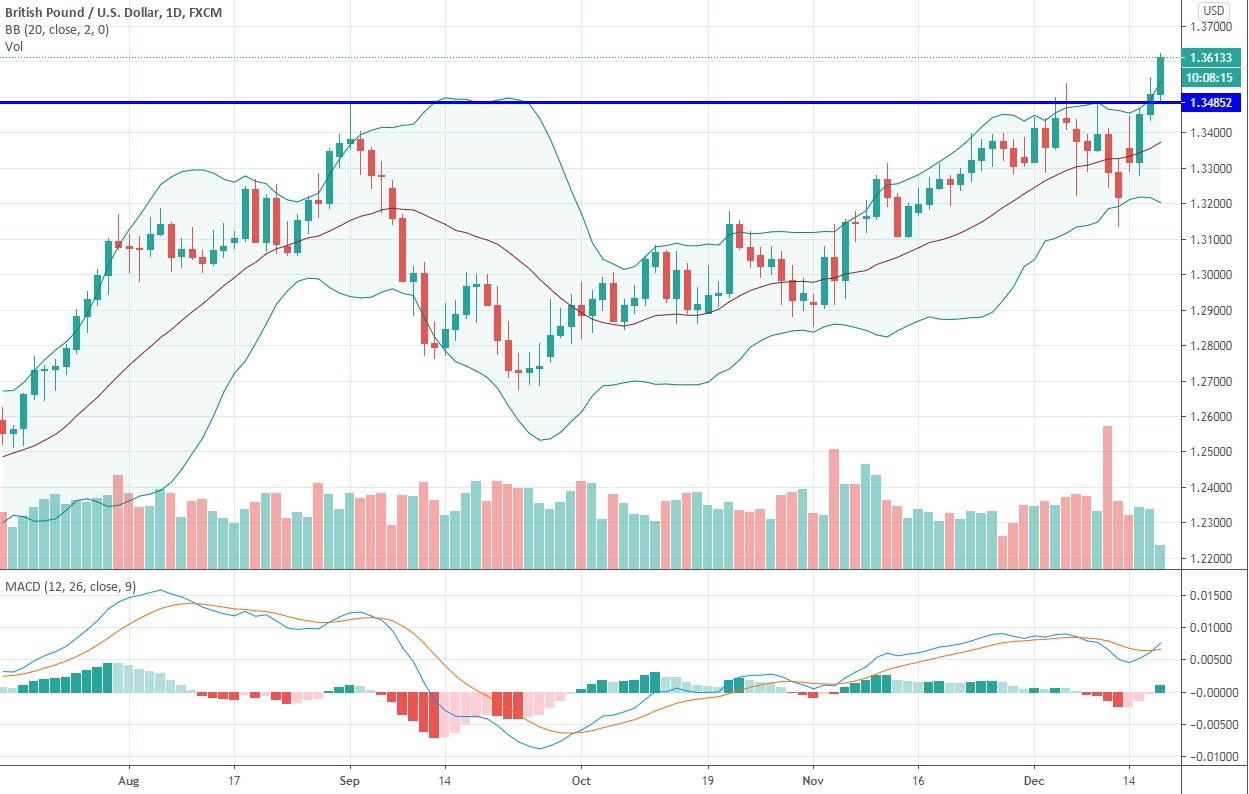
1D GBP/USD chart
However, BBs are not a standalone element of this trading strategy for Forex because the only reversal signal it provides is when the price action stretches beyond the boundaries of a band. However, that particular signal always requires confirmation from a non-correlated Forex trading indicator - in our case, it’s the moving averages divergence/convergence (MACD) momentum oscillator. Here, when the MACD line crosses the signal line and/or the zero line to the downside, it’s considered a sell signal, and vice versa. The idea behind this Forex strategy is the following: a trader must assess the situation on the market with the help of MACD or other momentum indicators (RSI, Stochastic) to see whether there’s a bullish or a bearish bias to it. Then he could trade the price action within BBs or wait for a squeeze and take the trade in the direction of the momentum. This strategy can also be used for trading reversals. In that case, the perfect setup for a trade is when the price penetrates the BBs while the momentum oscillator makes a bullish of a bearish crossover.
The daily GBP/USD chart provides a perfect example of how this Forex strategy can be applied. Here we see that the price is heading to the upside, stretching the BBs, which implies the increased volatility in buyers’ favor. MACD has just made a bullish crossover on the back of a growing green histogram. Moreover, the price had broken the resistance line at 1.3485 to the upside, which gives even more puff to the bullish momentum. Here one can enter a long trade immediately or upon the retest of the resistance line, with the stop-loss set around 1.34. Exit the trade when the price starts being pulled back inside the bands, confirmed by the bearish crossover on MACD.
Who to trade Forex successfully with Ichimoku Cloud
For some reason, not a lot of Forex traders are using the Ichimoku Cloud, or the Ichimoku Kinko Hyo,an indicator to develop trading strategies, probably because this tool is relatively new to mainstream and appears to be overly complicated at first. It might look like a total mess when you first plot it on the chart, but we reckon that it’s probably the only all-around useful technical indicator that allows traders to assess the momentum and the area of support/resistance at a glance. By the way, the Japanese word ‘ichimoku” literally means “a single glance.” This indicator consists of five elements, but it can do without the conversion and base lines, leaving only a lagging span, which provides confirmation, and two leading MAs that form that cloud.
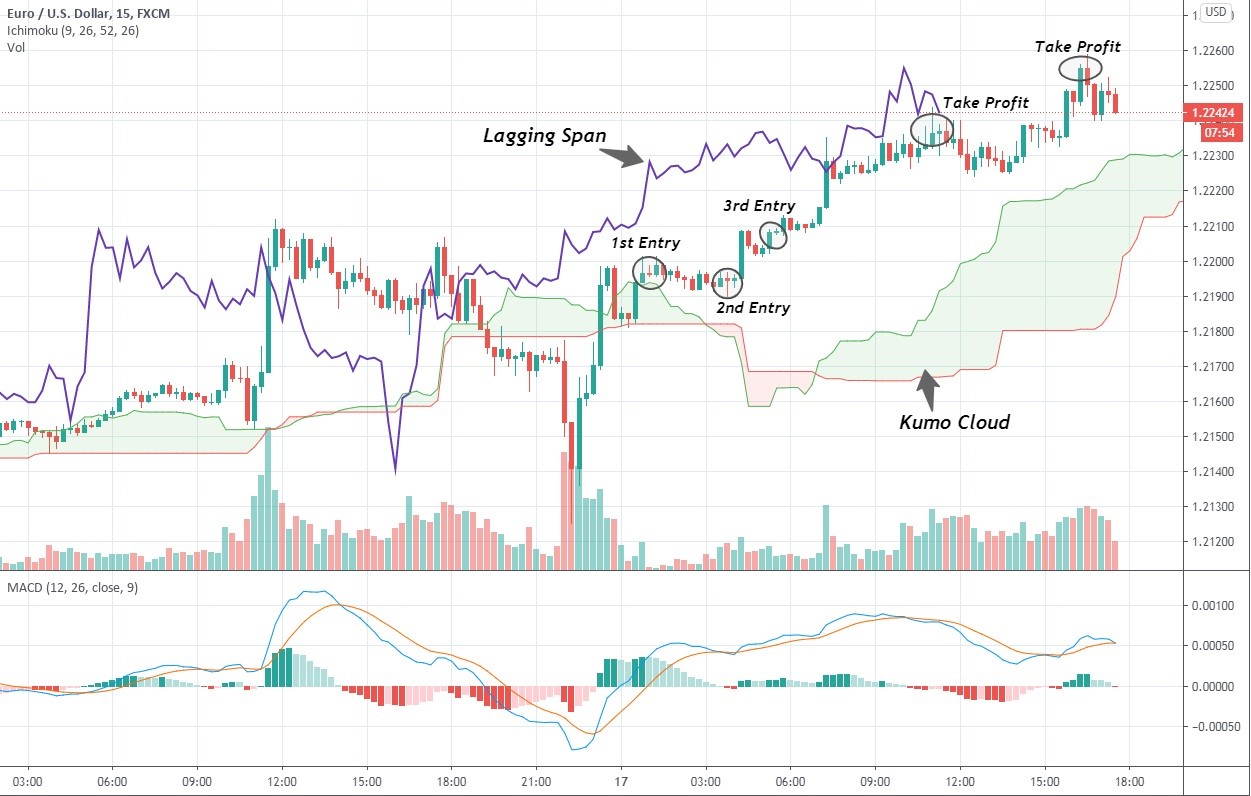
15M EUR/USD chart
What’s great about the Ichimoku Cloud-based Forex trading strategy is that this indicator pinpoints the high probability trades, and has proven to be reliable when determining trend reversal and entry/exit points. The market is considered to be in the bullish trend when the price action takes place above the Kumo cloud and bearish if the price descends below it. If the price is stuck inside the cloud, the market is indecisive, so refrain from taking any trades. The reason why no trades should be taken when inside the cloud is that this indicator is most accurate in a trending environment. Here’s a quick Forex strategy tip: in order to have an even clearer picture, it’s advisable to combine Ichimoku Cloud with a momentum oscillator like MACD.
Since this trading system is suitable for all time frames higher than 15M, let’s break it up on the 15-minute chart in the EUR/USD market. According to this strategy, a trader must make the first long entry once the price breaks the Kumo cloud to the upside and tests this level - 1.21982 in our instance. The second entry should be on the retest of that area at 1.21942.
In this particular example, the third entry was made after the bullish flag (continuation pattern) has been broken to the upside at 1.22096. Notice that all these entries were made after MACD entered the bullish control zone on the backdrop of a growing green histogram. Also, don’t forget to always confirm with the lagging span that accurately gauges the trend direction. According to this Forex strategy, the first exit point lies at 1.22364 (40 points profit); the second one should be at 1.22580 for a 61-pip profit.
New tricks for an old breakout trading strategy
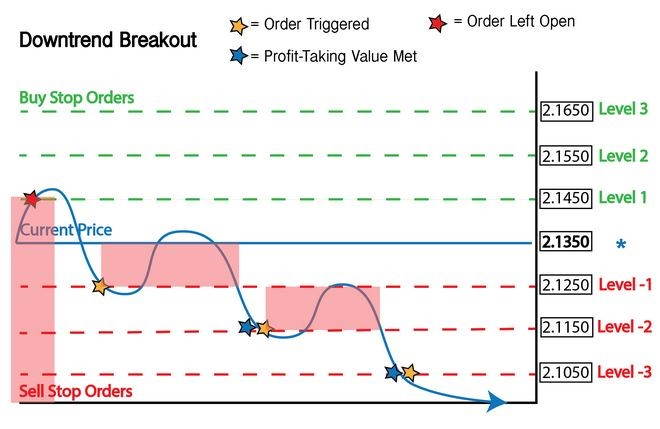
Trading a breakout is as old as the hills, but it still remains one of the best Forex trading strategies for 2021. In a nutshell, trading on a breakout implies placing a long or short order when the price of a currency moves above (below) the support (resistance) level, and outside the previously established range on the back of the rising bullish (bearish) volume. But while the essence of this Forex strategy isn’t too complicated, its execution requires a lot of skill because of a large number of fake-outs that is characteristic of most Forex markets. So, the gist of this strategy is to minimize the time when a trader gets caught in a fake-out and avoid being stopped-out before the market starts going the right way.
For the breakout strategy to work and result in profitable trading on Forex, you need to have these attributes present in order to consider taking a long or a short trade.
Let’s assume we have a break of a trendline with a hint at a trend reversal or a breach of a long-standing resistance with multiple test points, or a fall through the long-term support level on an increasing bearish momentum that is very common in Forex at times when markets are entering new territories, and the re-pricing occurs.
The first thing that a trader needs to see before considering a trade is a surging volume on the breakout. And even though it’s a rule of thumb for this particular trading strategy, many Forex traders tend to disregard it, being blinded by the desire for the breakout to happen. But in addition to growing volume, there also has to be an extension of the day’s range, which implies the participation of other traders in that move.
Always look for fundamental catalysts that can potentially impact the valuation of a certain nation’s currency, such as a sudden cut of interest rates or the release of important economic data. The presence of a catalyst drives new money to the particular Forex market and adds significant weight to the move, thus increasing the chances of a successful breakout.
Pay attention to the speed at which the price retests the previous support or resistance - it should happen quickly; otherwise, the move is most probably a fake-out. This rule is especially relevant for a more dynamic intraday Forex trading. A quick retest signifies that the momentum is on the trader's side and that the move carried a lot of weight. And never forget to confirm the move on higher timeframes.
Playing the exhaustion gap trading strategy
In Forex markets, the gaps occur during the large jumps in currency prices that often signifies that little to no trading took place in that area. Oftentimes, the gaps occur at the market open or under the impact of various technical or fundamental factors. A quick reminder that there are four types of gaps: breakaway, exhaustion, continuation, and common gaps. Please remember about the importance of proper gap identification because each type requires a specific Forex trading strategy to be applied. This particular strategy is suited for trading exhaustion gaps on the short side.
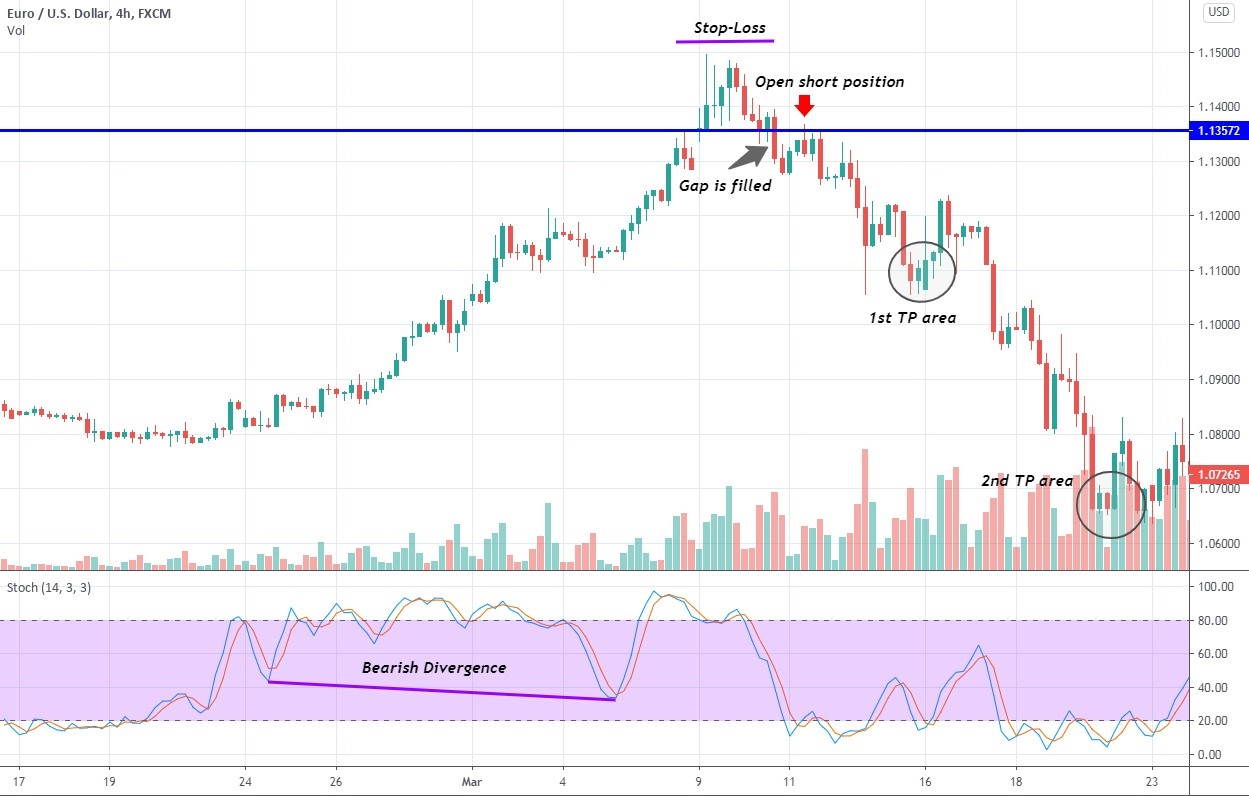
4H EUR/USD chart
Here we see the 4H EUR/USD chart where the price gapped up by 40 pips after having tested the resistance at 1.13572, thus turning this area into support. It is of the utmost importance to confirm that the gap is of the exhaustion kind, which in our case is done via a huge bearish divergence on Stochastic and the presence of a protracted bullish move with the predominance of shallow retracements.
According to this foreign currency trading strategy, a trader can either try and catch the top of the move and then open a short position, which is a very aggressive approach, or he can wait until the gap gets filled and the price tests the previous support and fails (less profitable but with the higher probability of success). The first take-profit area lies in the zone of bullish accumulation that occurred during the rally. In our case, it’s 1.11. The second profit taking is made when there are clear signs of a trend reversal. Here it’s the established support above 1.06 and the exit of Stochastic from the oversold area.
Jesse Livermore’s wisdom to enhance every Forex trading strategy
As you may know, Jesse Livermore is an icon trader who earned his reputation by making $100 million in a single day in the 1920s. His biography called “Reminiscences of a Stock Trader” is a bedside book of every successful Forex trader, and the market wisdom that this prominent trader had given us, modern-day traders, should be applied to literally every Forex trading strategy that you plan on using in 2021.
- According to Livermore, patience is key to profitable trading, whether it’s Forex, stocks, or cryptocurrencies. Traders must wait for all favorable signs to align before entering the market. After all, it’s the game of probabilities, and being able to wait for an opportune moment that brings about a high-probability trade setup is a cornerstone of every fruitful trading strategy in 2021, and years to come.
- Remember that price action always comes first, but if your strategy relies on indicators, make sure to give preference to the leading ones like Ichimoku Cloud.
- Take the emotional factor out of the equation. Once again, have patience and let the strategy prove its worth, without discarding it after a few bad calls.
- Don’t hesitate to close losing trades. If you let the losers run, even a time-proven trading strategy would fail eventually.


