The palladium market experienced a remarkable resurgence last week, witnessing a 23% surge from its near five-year low. This impressive rally in palladium futures, which lifted prices from a trough of 922 to a notable high of 1,156, marks a significant reversal from December’s losses. Such a robust performance in the palladium market indicates a growing bullish sentiment among investors, which could have broader implications for commodity markets.
Analyzing the Technical Landscape
The rally saw palladium futures breaking through several key resistance levels. Notably, prices overcame the descending resistance trendline from May’s highs and breached the 23.6% Fibonacci retracement level of the April-December downtrend at 1,097. This breakout suggests a shift in market dynamics, with buyers gaining the upper hand.
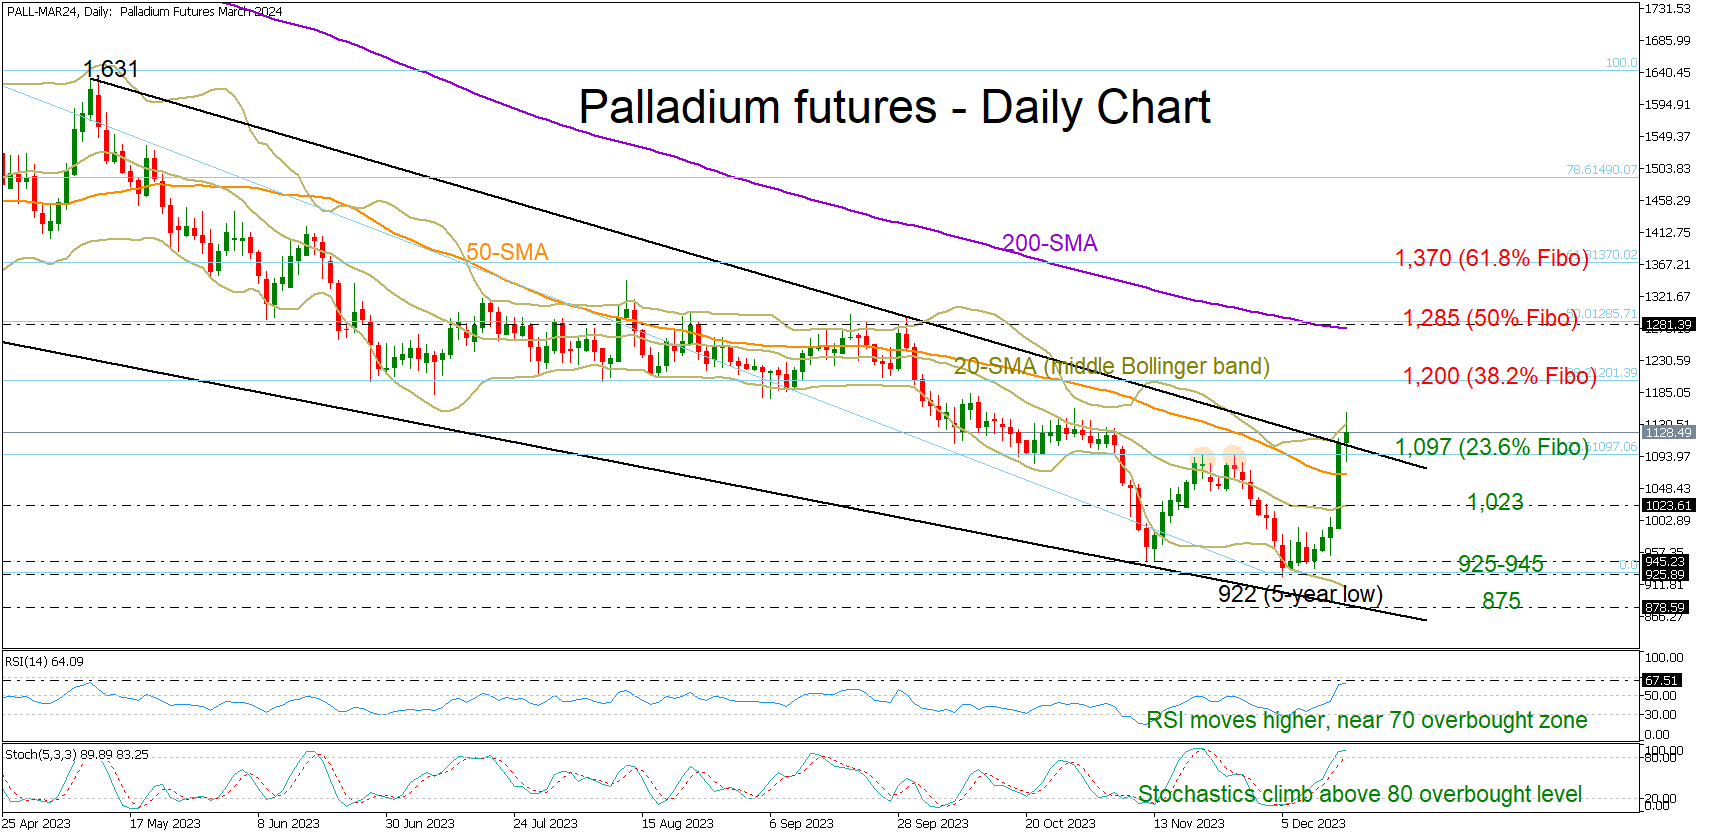
Despite reaching the upper boundary of the Bollinger Bands, technical indicators such as the Relative Strength Index (RSI) and the stochastic oscillator have not yet entered the overbought territory. This observation suggests that there might be room for further upside in the short term, giving traders and investors reasons to maintain a bullish outlook.
Key Price Levels to Watch
As palladium futures navigate this bullish phase, several critical price levels are in focus:
- The Immediate Resistance at 1,140: Overcoming this level could further fuel buying interest, potentially leading to an extended rally.
- The 38.2% Fibonacci Level at 1,200: A breach of 1,140 could pave the way for a test of this higher Fibonacci retracement level.
- The 200-day Simple Moving Average (SMA) and 50% Fibonacci Mark at 1,285: This zone is particularly significant, as it previously acted as a consolidation area before the onset of the bearish wave. A successful push above this level could significantly bolster the bullish momentum.
- The 61.8% Fibonacci Level at 1,370: Should the rally sustain, this Fibonacci retracement level could be the next notable target for the bulls.
Downside Risks and Support Levels
While the current outlook is bullish, potential pullbacks cannot be ruled out. Key support levels to monitor include:
- The 1,100 Area: This zone could offer immediate support in case of a minor retracement.
- The 20-day SMA at 1,023: A deeper pullback may find some respite around this moving average.
- The 925-945 Bottom Range: A return to this zone could indicate a significant bearish reversal.
- The Falling Support Line from June 2022 at 875: Breaking below this level could open the door for increased selling pressure.
Conclusion: A Bullish Outlook with Cautious Optimism
In summary, palladium futures are currently exhibiting strong bullish tendencies, with the market eyeing a sustained breakout above the 1,140 resistance. The technical indicators align with this optimistic view, though caution is warranted given the volatile nature of commodity markets. Traders and investors will need to closely monitor these key technical levels to gauge the strength of the current rally and to make informed decisions in the dynamically changing landscape of the palladium market. As always, the importance of risk management and staying attuned to broader market trends cannot be overstated in navigating these exciting yet uncertain waters.