Support and resistance levels are one of the most important concepts in Forex trading. Many technical tools rely on support and resistance lines to find or to confirm trade setups, and they are probably one of the first tools that new traders learn in trading. Support and resistance levels can come in various forms, and there are even complete trading strategies which rely purely on these levels. Given the importance of this topic, we prepared a detailed article which covers everything you need to know about it and shows how to calculate support and resistance levels in Forex.
Explaining support and resistance in Forex
First, let’s start by explaining what support and resistance levels are. A support line in Forex refers to a level where the price had difficulties passing below, signalling that the price could again act as a barrier for sellers. Often, there are many buy orders located around important support levels, which is why the price looks like it is bouncing off those levels. In other words, that price level is providing “support” to the price.
A resistance level, on the other hand, is a similar concept to support levels except that resistance levels form to the upside. A resistance level refers to a price where the market had difficulties breaking above in the past, signalling that the same price level could again act as a barrier for the market to the upside. Traders often place their sell orders around important resistance levels, which can accelerate a downward movement once the price reaches the resistance level.
Many technical tools rely on support and resistance levels to identify potential trade setups. These levels are pure price action and are relatively easy to grasp and trade on, which is one of the main reasons why so many Forex traders swear on support and resistance trading in Forex.
How to identify support and resistance levels in Forex
There are various ways to identify support and resistance levels in Forex. While horizontal S&R levels are the easiest to spot, other levels such as round number psychological levels, trend line S&R levels, and Fibonacci retracements require certain tools for a trader to identify them. Here’s a list of the most important support and resistance levels in Forex.
Horizontal support and resistance levels
Horizontal support and resistance levels are located horizontally in relation to previous support and resistance levels, making them relatively easy to spot. The following chart shows a horizontal support and resistance level.
Support level:
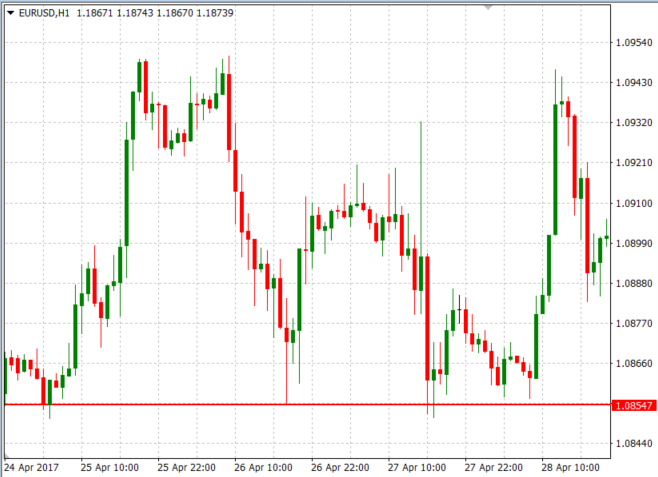
Resistance level:
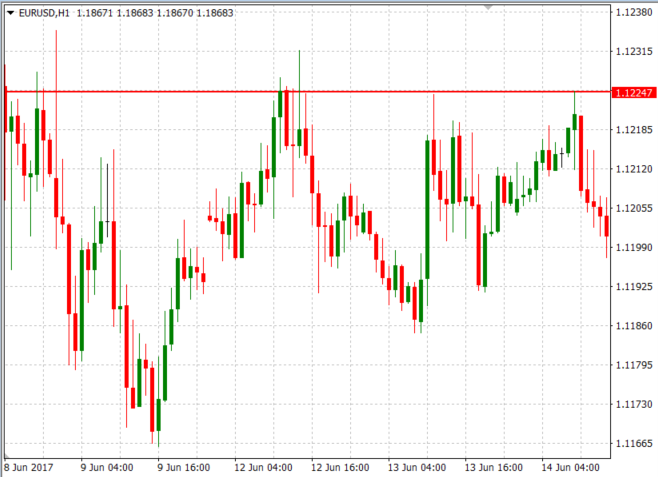
Traders usually trade on a bounce from a support or resistance level or a breakout of it. A large number of sell orders located just below a resistance level and just above a support level makes those levels hard for the price to break, eventually leading to a bounce off those levels. On the other side, a break of those levels is usually accompanied by a large buying or selling momentum, as buy orders are located just above a resistance level, and sell orders are located just below support levels. Pay attention to this the next time you’re trading horizontal support and resistance levels.
Round number support and resistance levels
Round number support and resistance levels refer to the psychological effect that round numbers have on market participants. Basically, when an exchange rate reaches a round number, such as 1.00, 1.10, 1.20, 1.25, 1.5, and so on, these levels often act as a support and resistance for the price depending on the side from which the price is approaching. This means that you can place your stop loss and take profit orders around round numbers, but also prepare for a potential bounce of the price off those levels.
Trend line support and resistance levels
We have covered horizontal support and resistance levels and round number psychological levels, which are also a type of horizontal level. Now, it’s time to explain how trend lines can act as a support and resistance for the price.
Trend lines connect higher lows during uptrends and lower highs during downtrends, making them an important tool for trend-following traders. However, they can also be used to identify potential price levels where the price might bounce. Each time the price approaches a rising or falling trend line, there is a high chance that the trend line will act as a support for the price during uptrends, or as a resistance for the price during downtrends.
As the following chart shows, a trader could enter into a long trade when the trend line shows to provide support for the price and exits when the price fails to make a fresh higher high or when the price breaks below the rising trend line.
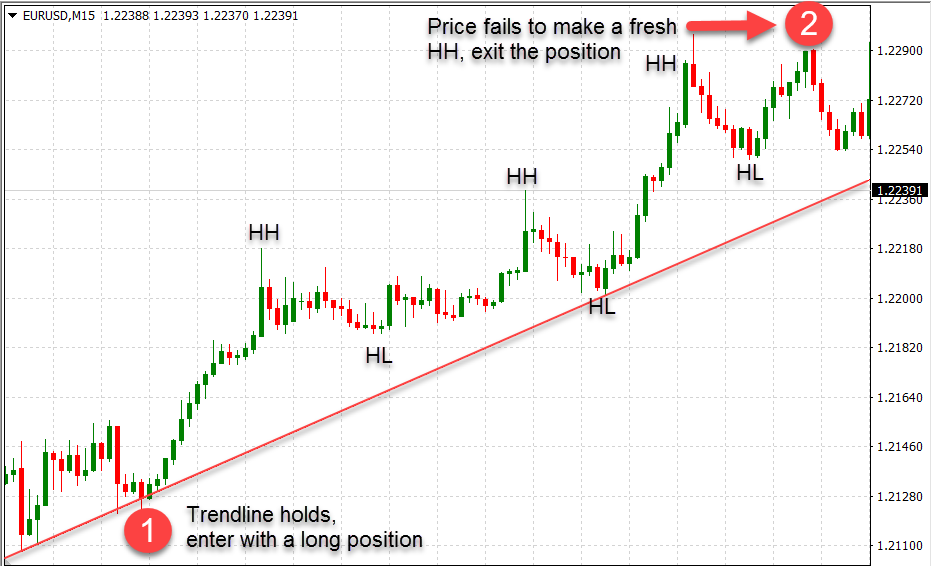
It’s important to note that for a trend line to be an important support or resistance line, the price has to respect the trend line at least three times.
Fibonacci retracement levels
Fibonacci retracement levels are special types of support and resistance levels that aim to identify a price level where a market correction might end. Currency pairs have a tendency to trend, and every trend consists of highs and lows forming the characteristic zig-zag pattern of price charts. A market correction is a counter trend price movement which forms after a strong movement in the direction of the trend, and according to the Dow Theory, market corrections usually reach around 50% of the impulse wave.
Leonardo Fibonacci was an Italian mathematician of the Middle Ages who discovered the famous Fibonacci sequence of numbers. You may have heard about the Fibonacci sequence, which goes like this: 1,1,2,3,5,8,13,21,34… In essence, each number represents the sum of the previous two numbers. What’s even more interesting is that by dividing two consecutive numbers of the Fibonacci sequence, you’ll always get the same result: 0.618. This is called the Golden Ratio and occurs in many places in nature, including the human body.
Now, let’s get back to trading again. Since the Golden Ratio is widespread in nature, market participants feel that this ratio could also be successfully applied to financial markets. Traders consider that a market correction of 61.8% of the impulse wave could act as an important support and resistance level, together with other important Fibonacci ratios such as 23.6% and 38.2%. If you apply the Fibonacci tool from recent low to recent high, the resulting Fibonacci retracements drawn on your chart could act as important price levels where the market could bounce and return to its underlying trend. This is shown in the following chart.
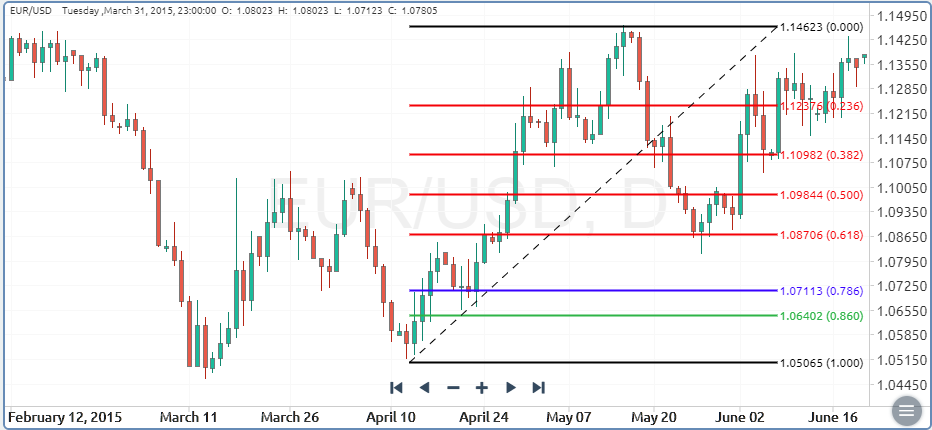
As you can see, the price found support at the 61.8% Fibonacci retracement level on the EUR/USD pair. However, bear in mind that Fibonacci retracement levels don’t have to be exact and precise support and resistance lines. Instead, the price can retrace at so-called support and resistance areas, of which the most important are in between the 38.2% and the 61.8% Fib level. So, consider these levels as areas, or zones, and not necessarily as precise lines.
Support and resistance levels change their roles
When talking about support and resistance levels in Forex trading, we need to touch on an interesting characteristic of these levels, which is their change of roles. When a support level breaks, be it a horizontal, round number, Fibonacci, or trend line support, that support becomes a resistance level in the future. Similarly, a broken resistance level becomes a support level in future trading. A popular trading technique has been built around this feature of support and resistance levels, which is called pullback trading. Basically, a trader would wait for the price to retest a broken support level (which now becomes a resistance), or a broken resistance level (which now becomes a support) to enter into the direction of the breakout. This fascinating concept is shown in the following chart.
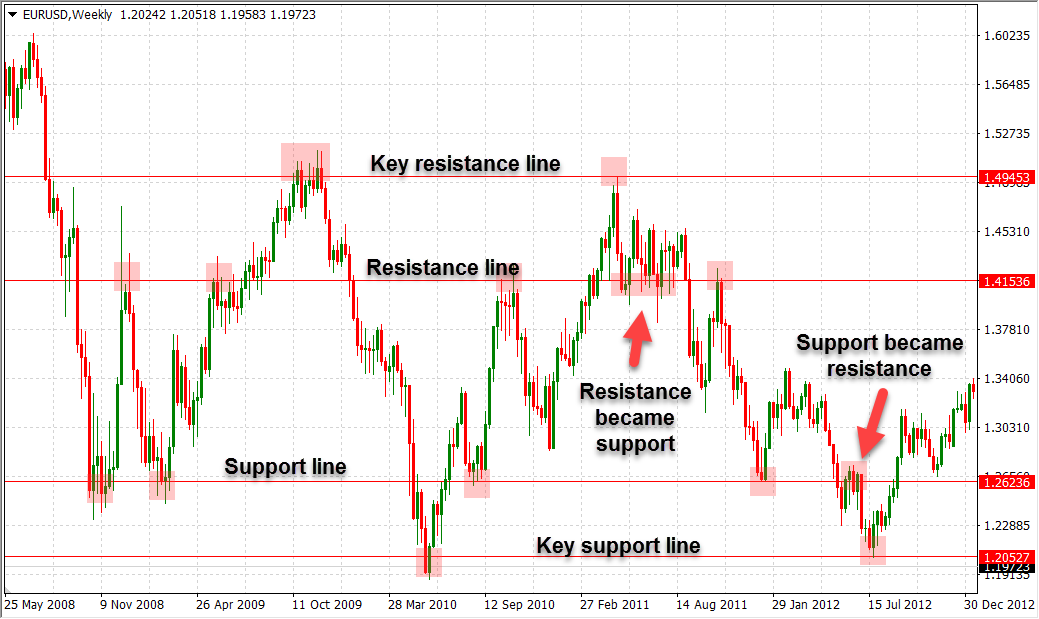
The chart above shows horizontal support and resistance levels on the weekly EUR/USD chart. Higher timeframes, such as the daily or weekly ones, are most of the time more reliable when it comes to support and resistance Forex trading. As you can see, the key resistance and key support lines are located above and below other less important levels, respectively. A broken resistance became a support, and a broken support became a resistance.
Final words: support and resistance levels in Forex
Support and resistance trading is an extremely popular way of trading the Forex market. These levels, which exist in other financial markets as well, are one of the most important concepts that novice traders should learn early on in their Forex journey. Simply put, a support level represents a price level where sellers had difficulties breaking below in the past, while a resistance level represents a price level where buyers had difficulties to breaking above in the past. As a result, these levels can be used to eventually predict the behaviour of market participants once the price reaches them again.
There are many types of support and resistance levels, such as horizontal levels, trend line levels, Fibonacci retracements, and round number psychological levels, which have been covered in this article. Besides these types, other technical tools can also be used to identify potential levels where the price could find a support or resistance, such as moving averages (the 200-day MA is an important dynamic S&R level), channels, pivot points, and so on.