


We can approach trading in a very similar vein as many do in Blackjack or how a casino operates, in that we can think in probabilities and potentially forge, and exploit an edge. Casinos have a small edge in each game and with a big enough sample they can exploit that – trading is no different.
To create an edge, we need a process – a repertoire from getting set-up at the workstation, right through to documentation and review of our trading activity. The strategy one utilises within the trading process is one that I will touch on here, as it's the single biggest factor that retail and pro traders focus on in their quest to become consistently profitable.
Arguably the two strategies which I've found to help push the odds in a client’s favour, especially when dealing in CFDs – one of the best trading vehicles for capturing short-term movement in price, long or short, across a broad range of markets, are momentum and mean reversion strategies.
Momentum trading is by far the more intuitive strategy though, so I will offer context here. Short-term trading is primarily focused on trying to profit from the aggregation of flow, be it investment, hedging, or the offshore demand for goods and services, much of which isn't immediately obvious or easy to track. Price action blends all of these factors and is the final arbiter. So, by aligning our bias to the flow of capital and the tape seen on the charts, we can give our trading an advantage.
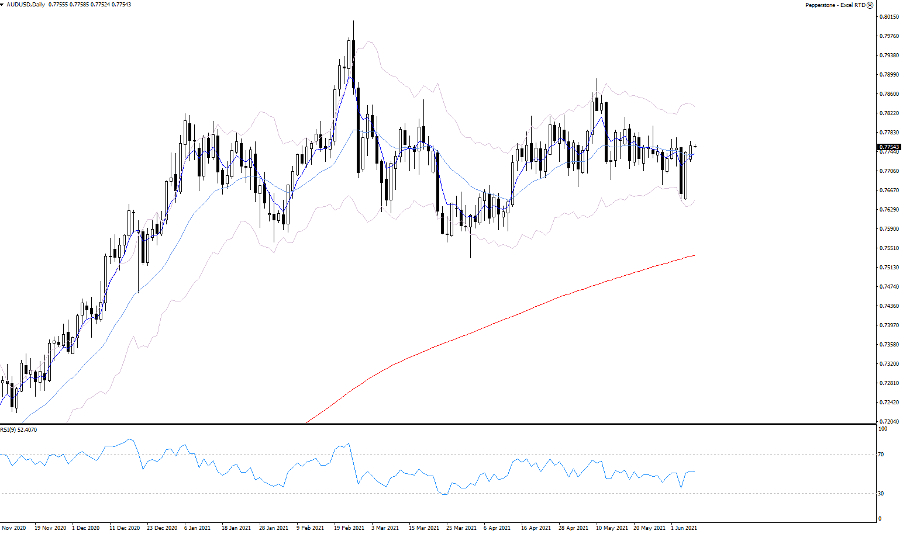
Newton’s First Law of Motion states that ‘a body in motion stays in motion’ and that's the crux of momentum trading. Obviously, we want to assess if a move is overly stretched, extreme or mature, but when capital is moving in one direction and buyers are prepared to pay higher prices (and vice versa) the idea is to jump on that move – for me, regardless of timeframe, going with a move, especially one that is impulsive with increased range expansion (in the candle) helps swing the odds in your favour. It can make trading far simpler.
The rate of change (ROC) is one of the best momentum indicators traders can use. However, to maintain discipline one overview I start with within my strategy is a basic momentum and trend model – this is one we put out to clients (reach out for more details) and can help you see the aggregation and flow of capital, even before the laborious scanning of the multitude of charts. It can be used on any market.
The model
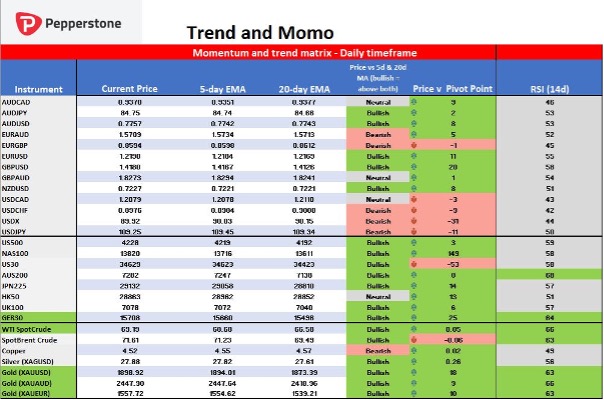
The logic
I don’t use ROC in this model, but I'm looking for agreement on three other variables – if the price is above the 5 and 20-day exponential moving average, the pivot point, and the 14-day RSI above 60, I take a bullish bias – this is filled green in the instrument column. If the price is below both moving averages, the pivot point and the RSI is below 40, I hold a bearish bias (denoted by the pink fill). Any conflict and I am neutral.
If the model suggests a bullish stance and the current daily candle is green, I can take the timeframe into 5 or 15 minutes and look at momentum scalping strategies – but these ultra-short-term trades should only be traded from the long side. Again, the same is true on short bias, where I can look at short positions within lower timeframes.
This model can be great for fundamental traders too, as it shows whether the market agrees with your view – for example, if I feel that OPEC may increase production (and I don’t think it's priced) and we’re in for a period of drawdown in Spot Crude, but the oil market is pushing higher, it suggests a low probability outcome for short positions. Or, if I feel Gold is about to rip higher and the matrix also shares this view, I can have a higher conviction on the trade – agreement is good.
The data in table above is sourced straight from MT4/MT5 using the excel RTD expert advisor. One of the many tools within the trading platform offering, that can help traders of all strategies and timeframes get an advantage when using technical or price action analysis.
Obviously, this is just an overview, but it can help with timing the market where being early on a view can be costly - and we'll always need to look at the set-up and assess our risk and position size. But, at a basic level by looking at factors that show the trend and momentum behind the move we can structure part of our process that can genuinely get us an edge in trading and a positive expectancy.


