The Moving Average Convergence Divergence (MACD) is a technical indicator that measures a relationship between two exponential moving averages. The MACD is displayed as a MACD line (blue line), a signal line (red line), and a histogram (green line) that shows the difference (i.e. divergence) between these two lines. The MACD line is the difference between two exponentially leveled moving averages – usually 12 and 26-period.
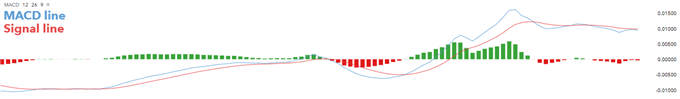
The signal line is generally a 9-period exponentially smoothed average of the MACD line. These MACD lines are fluttering around the zero line. This gives the MACD the characteristics of an oscillator that signals overbought and oversold zones when the indicator moves above or below the zero line, respectively.
What does the MACD measure?
The MACD measures momentum or trend strength using the MACD line and the zero line as reference points:
- When the MACD crosses above the zero line, it qualifies as bullish confirmation or the uptrend.
- When the MACD crosses below the zero line, it qualifies as bearish confirmation or the downtrend.
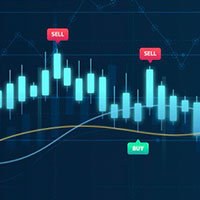
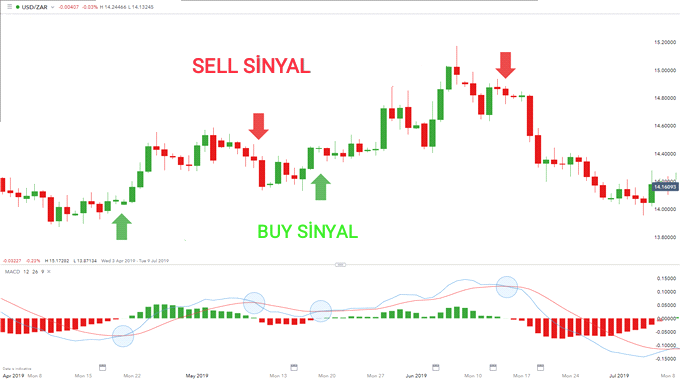
Additionally, when two MACD lines intersect, as shown in the chart below, traders can use it as a signal to place their buy or sell orders:
- When the MACD line crosses above the signal line, traders use it as a BUY signal.
- When the MACD line crosses below the signal line, traders use it as a SELL signal.
How to calculate the MACD?
Most charting platforms offer the MACD indicator and calculate it using the default periods mentioned above. The formula below breaks down the various components of the MACD to make the calculation easier for traders.
- MACD Line: 12-Period EMA – 26-Period EMA
- SIGNAL Line: 9-Period EMA
- HISTOGRAM: Difference between the MACD line and the signal line
As we’ve mentioned earlier, the MACD histogram represents the difference between two moving average lines. The MACD histogram oscillates above and below the zero line, where the MACD and the signal line intersect. When the MACD line is above the signal line, the histogram will have a positive value.
Conversely, when the MACD line crosses below the signal line, the histogram will be plotted below zero with a negative value. A zero value of the histogram indicates that the two moving averages crossover, which provides buy/sell signals.
MACD limitations
The MACD indicator works best in a trending market, which can limit its use for traders depending on their trading strategy. One of the main problems with MACD divergence is that it often signals a possible reversal. But when no actual reversal occurs, it’s considered a false signal. Traders need to really understand when exactly to use the MACD. Novice traders may find this indicator difficult to use at the beginning.
That’s why it’s essential to understand the nature of the simple moving average (SMA) and the exponential moving average (EMA). The MACD has settings that can be changed to give almost limitless numbers of variations which means results can differ from person to person.
This subjective nature of the MACD destroys its consistency. Traders need to follow two basic rules when using the MACD:
- Select EMA parameters
- Use an appropriate timeframe as the MACD can work differently on different timeframes
Spotting a trend with MACD
Spotting a trend is probably one of the most important tasks for every technical analysis trader. And while it may seem quite challenging, the MACD can be extremely helpful in this regard. There are 3 steps when determining and entering a trend using MACD:
- Determine the direction of the trend.
- Use the MACD crossover to spot trading opportunities in the trend direction.
- Use the MACD zero line to manage risk.
Determine the direction of the trend
One way to identify a trend is to use the 200-day moving average. If a trader wants to enter a trade, he can apply the 200-day moving average to the price chart to determine if prices are consistently trading above the average range. In the example below, the EUR/USD chart shows a dominating uptrend, confirmed by prices that are consistently trading above the 200-day moving average. When this happens, the trader can proceed to step two to identify possible entry points.
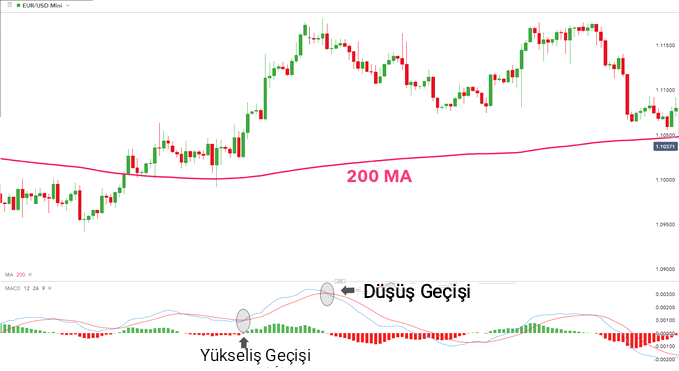
Once the trading bias is established, the trader can start looking for buy signals in the same direction as the current trend. In the chart above, the MACD crossover can be used as a possible entry signal when the price is above the 200-day moving average.
As indicated in the chart, the trader may want to place a long position on the first MACD crossover (highlighted on the chart). At this point, the MACD line (blue line) is above the signal line (red line) and the price is still trading above the 200-day MA.
Use the MACD zero line to manage risk
When the market is trending, it is important to keep in mind that the trend will eventually begin to exhaust. In an uptrend, as shown in our example with EUR/USD, when there is a bearish crossover, it could be a sign that the momentum of the uptrend is slowing down and the pair may change its direction.
Our trader who opened a long position may want to exit the trade at this point, but this may only be a temporary pullback. When a possible downtrend occurs, traders can check if the MACD line crosses below the zero line to confirm the bearish trend. If it does, they can exit the trade.
Using MACD to identify the end of a trend
The trend following strategy is popular among both novice and experienced traders. Most traders enter a trade at the end of a trend only to see the reversal of the trend.
Can the MACD indicator help traders find an exhausted trend?
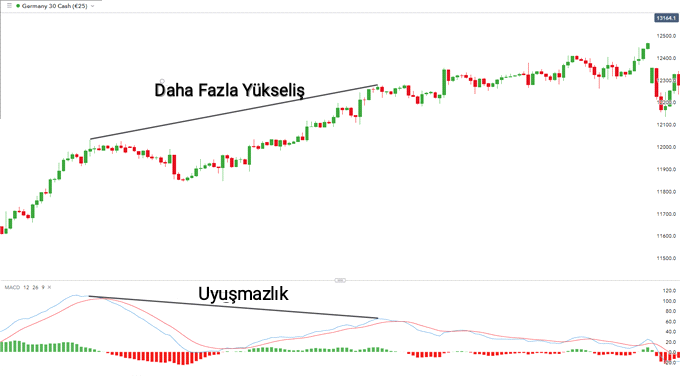
A good way to identify the trend reversal is by using the MACD divergence. A divergence normally occurs when the indicator moves in an opposite direction from the price, which indicates that the trend momentum is slowing down. Below we can see that the DAX 30 is forming a higher high on the price chart, while the MACD is creating a lower high, which is considered a divergence. This is the first indication that the momentum of the current trend is slowing down. At this point, investors should consider reducing and possibly closing their existing long positions.
Once the divergence is identified, traders can look for the end of the trend using a classic MACD crossover. Traders who enter long positions can exit the trade on the next bearish crossover (where the blue MACD line falls below the red signal line in a downtrend). This can protect the trader from losses in the event of a reversal.
While the MACD trading strategy is often used to identify possible entry points, it is also effective for identifying the exit points, as shown in the example with the MACD divergence. While the timing of an entry is extremely important, risk management should never be overlooked.
MACD indicator: Summary
The MACD is a unique technical analysis tool because it serves both as an oscillator and the MACD crossover indicator., which rovides two signals in one indicator allowing for a less complex chart. Traders may find this tool very helpful, which makes the MACD worth studying and understanding.
If you like our articles, follow us on Facebook and Instagram. Stay tuned for more interesting posts on our blog. We post new material several times a week.