The awesome oscillator is a market momentum indicator that is used to define reversals and corrections of the price. It's one of the easiest but most effective trading tools that provide a wide range of signals. In this tutorial, we will talk about all the signals the indicator gives and share reliable trading strategies.
What Is the Awesome Oscillator Indicator: Definition
The awesome oscillator is a momentum indicator and one of the leading market indicators which many traders use. The main idea is to compare recent price moves to historical movements.
The awesome oscillator is a momentum indicator. The main idea is to compare recent price moves to historical movements.
The awesome oscillator indicator was developed by well-known Bill Williams. Most likely, you have used his indicators such as Alligator, the Gator Oscillator, Fractals, and the Market Facilitation Index. Traders apply all Williams' indicators to confirm trends and find reliable reversal points.
Example
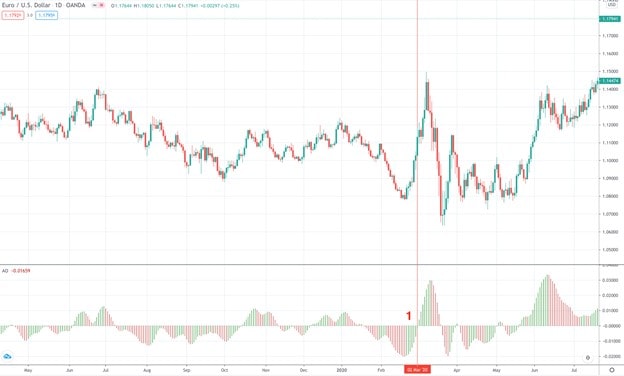
Let's see what the indicator looks like. It's a daily chart of the EUR/USD pair. The green bars are bullish, while the red bars are bearish. 1 is the 0 line, which will play a significant role in trading strategies.
The Awesome Oscillator Indicator: Let’s Count
Although the awesome oscillator is calculated automatically, it's worth knowing how the indicator is built. The formula is simple: AO = SMA5 - SMA34
To calculate the awesome oscillator indicator, you need to subtract a 34-period simple moving average of median prices from a 5-period SMA of median prices. We don't provide an accurate period for moving averages because the indicator can be applied to any period.
Simultaneously, moving averages are not calculated based on close prices but the midpoints of each used candle. To get a midpoint, you need to add the session's high and low prices and divide the sum by two: Midpoint = (H+L)/2
Awesome Oscillator: Catch Its Signals
The indicator provides a wide variety of signals. That's why traders all around the world use it. Let's consider the signals you can catch applying the awesome oscillator indicator on the price chart.
There are four main indicator's signals. They are 0 line crossover, twin peaks, saucer, and divergence.
- Signal 1: On the chart at the beginning of our article, you could see that the indicator moves around the 0 line. If bars rise above the 0 level, it's a signal of upward movement. If the indicator falls below the 0 line, we get a bearish signal.
- Signal 2: When the awesome oscillator forms two tops above the 0 line and the trough between highs is above 0, it's a sign of the downward movement. At the same time, the second top should be closer to the 0 line and lower than the first peak. There should be bearish bars after the second peak. Vice versa, if the AO indicator's lows and the trough between them are below the 0 line, it's a buy signal. The second low should be closer to the 0 line and above the first one. The second bottom is followed by bullish bars.
- Signal 3: The next signal has a specific name - saucer. It's a three-bar pattern. The bullish pattern has one bearish bar; the next bar is also bearish but smaller; the third bar should be bullish. All the bars are above the 0 line. A bearish pattern is represented by the first bullish bar; the second bar is also bullish but smaller than the first one. The third bar is bearish. All the bars are below the 0 line. Although the awesome oscillator indicator is quite reliable, there is no indicator that provides 100% accurate signals. Thus, we recommend using the chart, candlestick patterns, and other indicators to prove the signals of the AO.
- Signal 4: The fourth signal is divergence. You may know that many oscillators are used when defining convergence/divergence between the price chart and the oscillator - MACD and RSI are widely used for that. You can also apply the awesome oscillator indicator to find a divergence with a price chart. All you need to do is to draw a line between two tops/bottoms of the price and the oscillator. If they diverge, it's a signal of the upcoming market direction. To learn more about convergence/divergence, read our guide.
The Awesome Oscillator Strategy: Top Choice
The awesome oscillator indicator can be used for any asset and on any timeframe. Thus, it's implemented in a wide range of strategies. Let's look at the most reliable ones.
Bullish/Bearish Saucer Strategy
If you read our article carefully, you remember that the saucer signal is based on three bars.
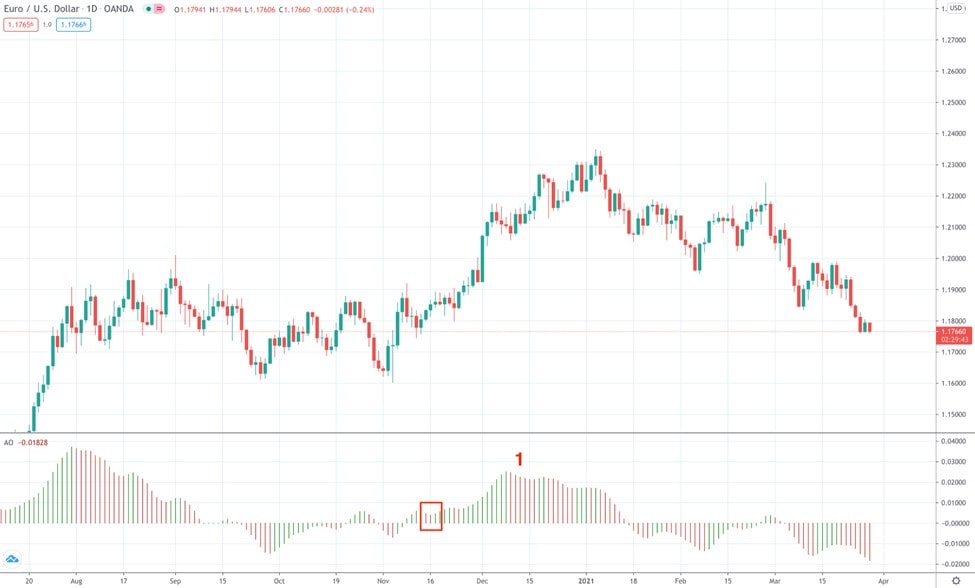
- Step 1. Find a formation of a saucer signal. It can be either bearish or bullish. We found a bullish saucer on the daily chart of the EUR/USD pair.
- Step 2. You can open a trade at the formation of the third bar. However, it can be an unconfirmed signal. Thus, we would recommend opening trade after the bar is formed. In our case, we would open a long trade.
- Step 3. Take Profit level is not defined accurately in this strategy. However, you can close the trade as soon as the AO moves in the opposite direction.
- Step 4. The Stop Loss order is determined by the risk/reward ratio.
Twin Peaks of Awesome Oscillator
As for any strategy, two peaks provide signals for bearish and bullish positions.
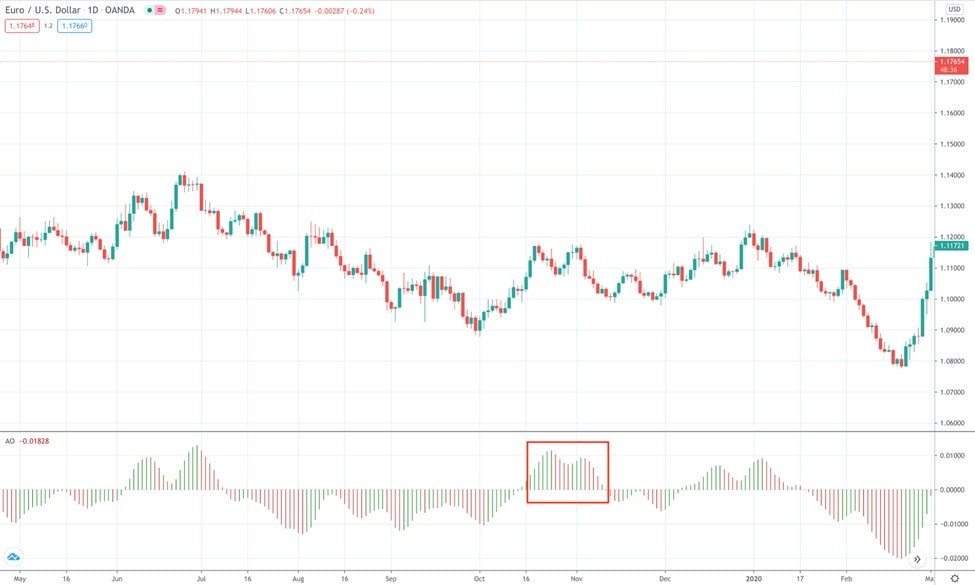
- Step 1. Define whether twin peaks are bullish or bearish. When we have bullish peaks, the awesome oscillator indicator is below the 0 line. In the case of the bearish peaks, the AO is above 0.
If it's a bullish signal, the second low should be higher than the first one. In the case of a bearish signal, the second top is lower than the first peak.
An important condition is that the histogram after the second low should also be bullish in a bullish signal. In contrast, in a bearish signal, the histogram after the second peak should also be bearish.
- Step 2. Open a trade after the formation of the second low/high.
- Step 3. The Stop Loss order can be placed several pips below the second low / above the second peak.
- Step 4. The Take Profit level can be counted according to the risk/reward ratio.
Bullish/Bearish Zero-Line Crossover
As we said above, the crossover of the zero line is also a signal for traders.
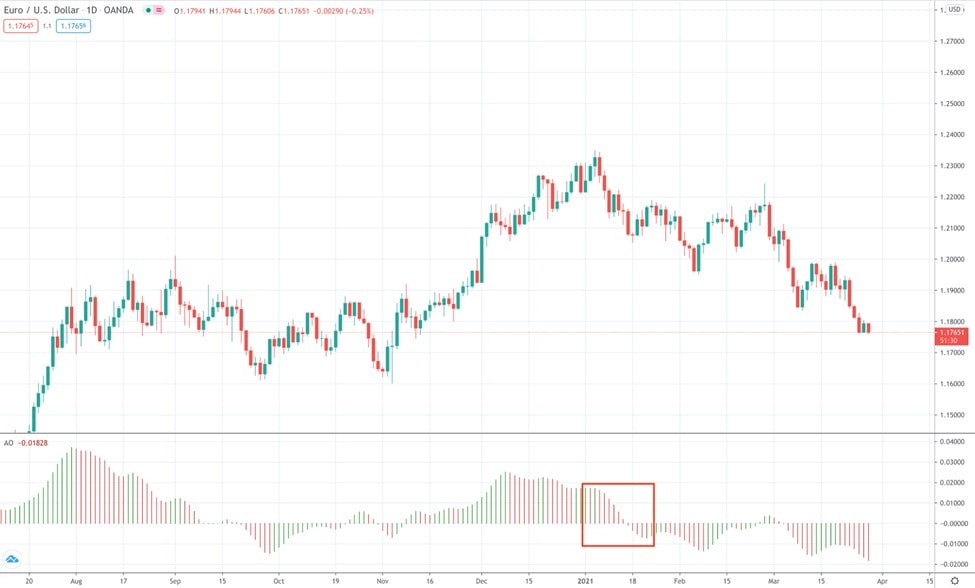
- Step 1. Find a moment when the awesome oscillator crosses the 0 line upside down for a short trade and bottom-up for a long trade.
- Step 2. The signal will be more reliable if there are at least three bullish bars before the bullish crossover and at least three bearish bars before the bearish crossover.
- Step 3. Open a trade on the crossover.
- Step 4. Take Profit level is not defined accurately. Close the trade as soon as the AO turns around, or there is a reversal signal from candlestick or chart patterns.
- Step 5. The Stop Loss order can be indicated by the risk/reward ratio.
The Awesome Oscillator Trading Strategy: Divergence
Previously we told about the divergence. Now, let's look at a real example and will trade using the divergence. Below you can see the signals divergence provides.
|
Type |
Price |
Indicator |
Signal |
|
Regular: a sign of reversal |
|||
|
Bearish |
Higher High |
Lower High |
Potential reversal down |
|
Bullish |
Lower Low |
Higher Low |
Potential reversal up |
|
Hidden: a sign of correction and continuation |
|||
|
Bearish |
Lower High |
Higher High |
A downtrend is likely to resume |
|
Bullish |
Higher Low |
Lower Low |
An uptrend is likely to resume |
Look at the chart below.
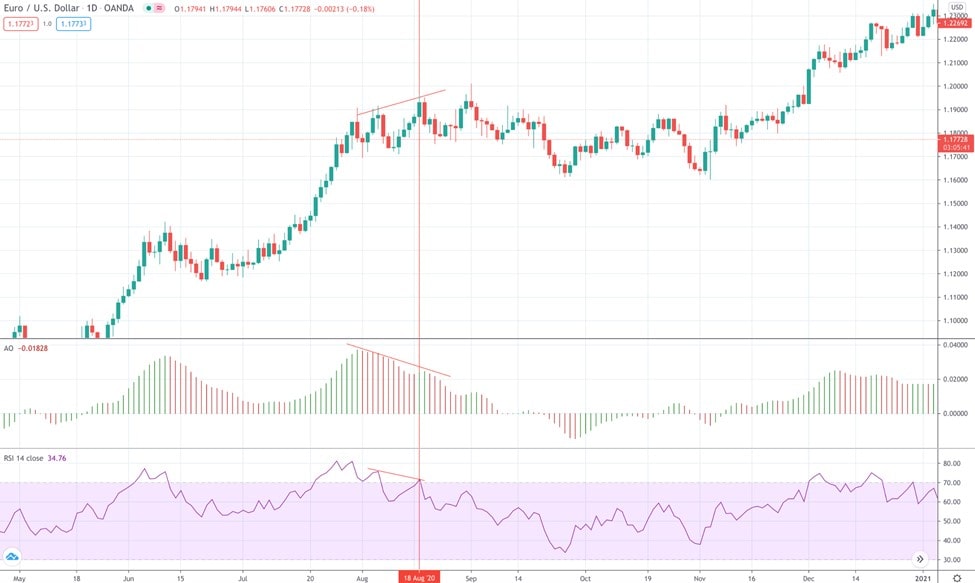
- Step 1. Apply the awesome oscillator and the RSI indicator on the chart. A great advantage of the divergence strategy is that it can be used on any timeframe you trade. We used a daily chart of the EUR/USD pair.
- Step 2. Look for a divergence. We found a regular bearish divergence. Why did we implement two indicators? Because it's vital to confirm signals. We got a divergence between the price and the awesome oscillator and RSI indicator. Also, the RSI indicator crossed the upper boundary of the 70 level upside-down.
- Step 3. Open a short position as soon as you get signals of downward movement.
- Step 4. Stop Loss can be placed several points above the latter pick.
- Step 5. We recommend using trailing Take Profit. The first target can be defined by the risk/reward ratio. The reward should be at least two times bigger than the risk. The TP level can be increased in case you are sure the market will keep going down.
The opposite steps are applied for a bullish divergence.
Find Awesome Oscillator in MetaTrader 4
A big advantage of the Awesome Oscillator is that it's easy to apply it to the price chart.
If you trade in MetaTrader, here are several steps to implement the oscillator on the chart. The AO is a standard tool. To add the indicator to the chart, click “Insert”', then choose “Indicators”, Bill Williams deserved a separate tab in MetaTrader. Thus, you click “Bill Williams” and choose “Awesome Oscillator”.
The awesome oscillator is one of the best indicators as it doesn't require changing settings. All you can change is the color scheme.
The awesome oscillator is one of the best indicators as it doesn't require changing settings. All you can change is the color scheme. Green (for bullish bars) and red (for bearish bars) are used more often, but you can choose any color. It's important you remember what the colors mean.
The Awesome Oscillator Indicator: Reliable or Not
The awesome oscillator is one of the most reliable indicators, and here is why:
- The AO is a market momentum technical indicator.
- It can be used for identifying trend reversals and corrections.
- The indicator provides entry and exit levels.
- There are four main signals you can catch. They are saucer, divergence, twin peaks, and 0 line crossover.
Although it's not required to change its settings, the AO provides many signals. That's why it's vital to practice before entering the real market. For that, you can open a Libertex demo account. The demo account includes a wide variety of instruments and assets, including forex and CFDs.
Why to trade with Libertex?
- access to a demo account free of charge
- technical assistance to the operator 5 days a week, from 8 a.m. till 8 p.m. (Central European Standard Time)
- leverage of up to 1:600 for professional Ñlients
- operate on a platform for any device: Libertex and Metatrader
Awesome Oscillator: FAQ
Let's sum up what we have learned.
How Do You Read Awesome Oscillator?
There are four main indicator's signals. They are 0 line crossover, twin peaks, saucer, and divergence.
How Is Awesome Oscillator Calculated?
To calculate the awesome oscillator, you need to subtract a 34-period simple moving average of median prices from a 5-period SMA of median prices.
How to Use Awesome Oscillator in Forex Trading?
The awesome oscillator can be used for any market and on any period. Apply the main signals we listed above.
How Do I Find Awesome Oscillator in Excel?
Subtract a 34-period simple moving average of median prices from a 5-period SMA of median prices. To get midpoints of the SMAs, you need to add the session's high and low prices and divide the sum by two.