


Any trader needs to define the direction of the currency pair. It is also important to remember that the market movement is defined by the strength and weakness of the currencies that make up the pair. But how do we define the strength of a currency? There are different ways, one of which is fundamental analysis. However, it's not 100% accurate. What provides a clearer view of the currency is the currency strength meter. Read on to learn more about the not famous but interesting indicator.
Currency Strength Meter: Definition
The currency strength meter is a general name of the indicator that shows whether you’re dealing with a strong or weak currency. This algorithm-based indicator relies on the exchange rates of various currency pairs to provide a degree of each currency’s strength.
The currency strength meter analyzes each currency separately, not the currency pairs.
You might be familiar with the standard RSI indicator, Awesome Oscillator, or the MACD tool. But with the currency strength indicator, it is more complicated as there is no standard tool. You can find different versions of it on the Internet and customize them to the platform you use.
To find the right one, you should apply several ones and check which one works better. Also, it's worth reading reviews on the indicators you want to use.
The currency strength meter refers to various indicators that measure the strength or weakness of the currency.
As there is more than one version of the meter, you should know the differences. The more advanced variants implement their own weightings and may include other indicators that measure the currency's strength. It helps to provide trading alerts. Simpler versions, on the other hand, don't use any weighting.
However, the main principle remains similar. To depict the strength or weakness of the EUR, the indicator calculates the strength of the pairs that include the EUR (for instance, EUR/USD, EUR/GBP, EUR/JPY). After the calculations, we get the overall strength of the Euro.
The indicator is widely used on MetaTrader 4 (MT4) and MetaTrader 5 (MT5). You can also find it on any platform where custom indicators are supported or on the web.
What the Currency Strength Meter Looks Like
Usually, we provide a real example, showing you how the indicator looks like and how it works in the real market. It's more complicated with the currency strength indicator as there are different variants of it.
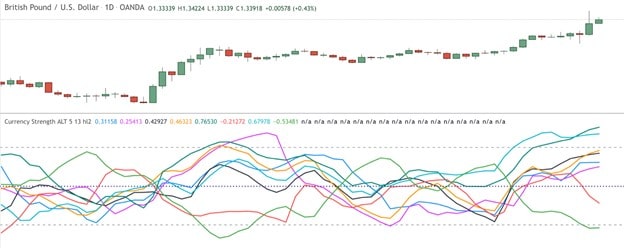
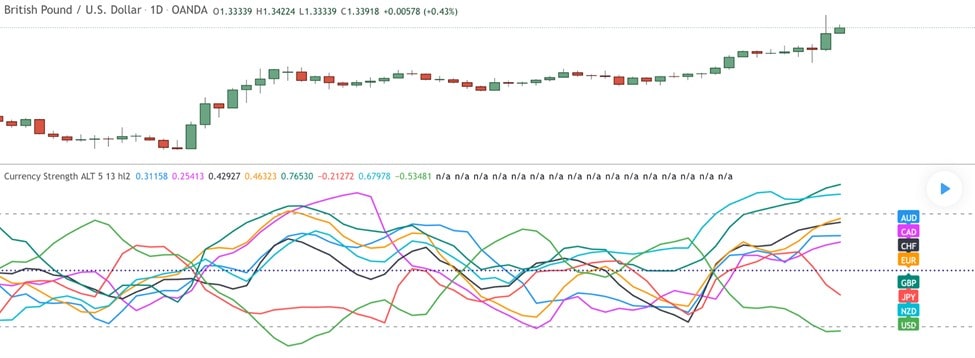
The most common currency strength indicator consists of lines that move around the zero level. The lines can have different colors and be smooth or rough, which depends on the algorithms and parameters applied.
 ​
​
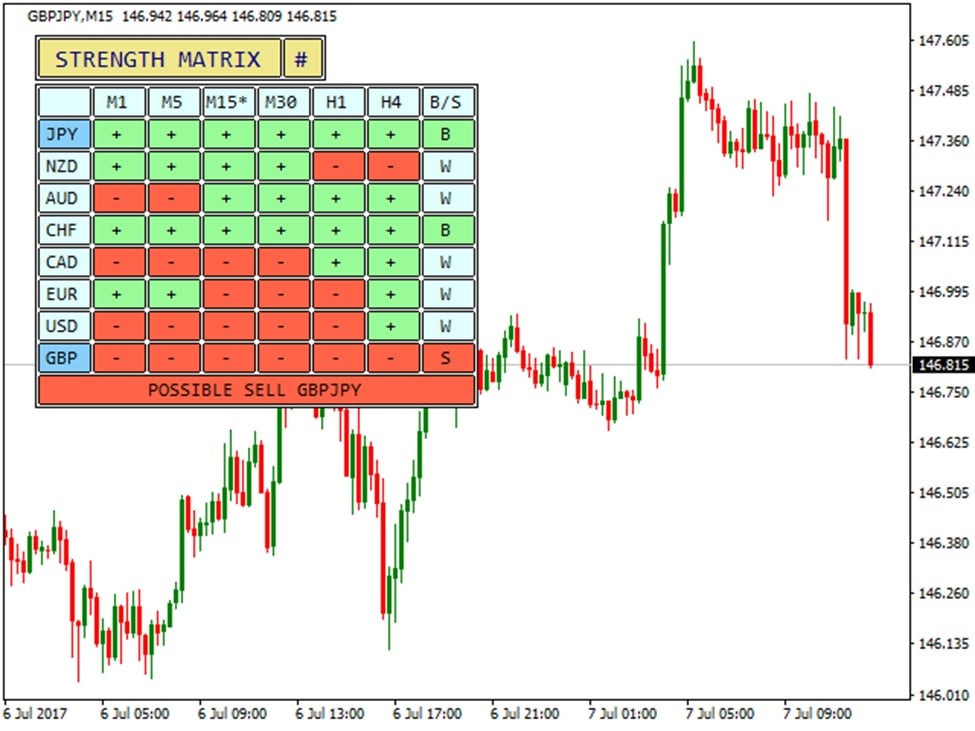
Another type of currency strength meter is a correlation matrix. It highlights the strength of currencies on different timeframes.
How Does the Currency Strength Meter Work?
The main idea of any currency strength indicator consists of the following points:
- The indicator defines the base currency.
- Then it pairs the currency with all other currencies that are available for such action.
- After that, the indicator measures strength regarding each paired currency.
- In the end, the average score is calculated.
The goal of using the indicator is not to define the strong currency and start buying it but to identify whether the currency in the pair is strong or weak. For example, we have a EUR/USD pair. If it rises, it doesn't mean the Euro is strong; the US dollar may be weak.
The indicator is not used to define the strong currency and buy it but to identify whether the currency is strong or weak in the pair.
As we said above, there are different versions of the indicator. Even though each can have a specific measuring system, the 0-10 range is the most common. Usually, if the reading is closer to 10, the currency is stronger.
Let’s consider how the line currency strength indicator works.
The indicator consists of the lines that depict currencies. These rules apply to any line version of the currency strength indicator:
- The line that is higher depicts a stronger currency. The signal is stronger if the first line is above the 0 line but the line of another currency is below 0.
- If the line goes up, the currency gains momentum.
- If the line moves downwards, the currency weakens.
You can integrate a currency strength indicator into your own strategies and trading style.
Currency Strength Indicator in Action
Okay, the idea of the indicator is clear. Now let's take an in-depth look at how to use it in real trading.
Usually, the indicator is used to either confirm a trend or its reversal. By applying it to the chart, you can define a weak and a strong currency. Thus, you’ll know which currency pair to buy and which one to sell.
However, you should keep in mind that the currency won't be equally strong or weak relative to other currencies in pairs.
The main idea is to buy a strong currency against the weak one or sell the weak one against the strong one.
Approach 1: Find the Strongest and the Weakest
It's the easiest and safest approach. All you need to do is define the strongest currency and the weakest one and trade their pair.
For example, if the AUD is the strongest and EUR is the weakest, you should sell the EUR/AUD pair. So, you will simply trade in the trend's direction. The same approach can apply to the trend reversal if you see the currency reached extreme readings of strength or weakness.
Approach 2: Average Readings
Of course, it doesn't mean you can trade if only there are extremes of the currency readings. However, this approach is riskier because the currency's strength doesn't have a determined limit as gold does, for instance. Thus, it means the currency can continue getting stronger or weaker, and you will simply stay in a bad trade.
Currency Strength Indicator: Limitations
Like any other technical tool, the Forex strength meter has limitations that you should consider while trading.
No Guarantee
The currency strength indicator doesn't give a 100% accurate understanding of the currency's strength or weakness.
When applying this technical indicator, traders believe that the USD strength or the GBP weakness means it's time to sell the GBP/USD pair. However, it's not like that. The currency strength indicator simply provides additional confirmation. However, it's not a trigger of your trades.
A trader should also be careful when implementing the indicator on different timeframes. If the indicator shows that the EUR is strong on the 1-hour timeframe, it doesn't mean the currency is strong on a monthly one.
Also, it's vital to follow the current market situation when you’re actively trading. A strength or weakness can be a short-term occurrence caused by fundamental issues.
Measures Strength to Major Currencies
You know there are major currencies that are highly liquid and exotic currencies that are highly volatile and illiquid.
If you see the USD is stronger than the TRY, it doesn't mean it will also be stronger than the GBP or the JPY, for instance. Don't be mistaken - instead, measure the strength of the currency against major peers.
Higher Timeframes Are Better
Although the indicator can be applied to any timeframe, only higher periods provide a more accurate measurement of the currency's strength.
Too Many Versions
Another disadvantage of the currency strength index is the wide variety of versions. It's challenging for a trader to figure out which one is the better version.
Using the Real Currency Strength Meter: Benefits
Despite the limitations we just discussed, the currency strength meter has many advantages, and that's why it's used by traders worldwide.
- Useful Currency Strength Indicator: Although the indicator doesn’t provide 100% accurate signals, it’s useful when defining the trade’s direction. The indicator can provide an overview for a wide range of currencies.
- Simplicity: The indicator is simple in use. All you need to do is apply the indicator, and it will do all the calculations itself. Moreover, you don’t need to change settings.
- Can Be Applied for Free: There are many versions of the indicator, and they are openly available on the web. So, you can simply find the free versions and try them all.
- Saves Your Time: The indicator allows investors to skip hours of fundamental analysis. Of course, it does not mean you should neglect fundamental analysis - but it does confirm trading ideas.
- Filters Currency Correlations: When trading multiple pairs, you should always remember that currencies can have a negative or positive correlation. The currency strength indicator will show you whether currencies are both strong or weak. Even if you see that currencies that are included in the pairs are both strong, but the pairs usually move in opposite directions, don't open the same trades.
- Alerts of High-Risk Trades: The currency strength indicator can prevent you from double risk. For instance, opening the same trade for negatively correlated pairs is a double risk. If you know that one of the currencies is strong and another one doesn't provide signals of strength or weakness, you should not open opposite trades for these pairs.
Tips for Traders: How to Use the Indicator to the Fullest
We would like to share some tips that will allow you to use any version of the currency strength indicator.
- Don't trade negatively correlated currencies in the same direction. This rule applies to the correlation strategies when you shouldn't open trade in the same direction, knowing the pairs mostly move in opposite directions. The currency strength indicator is a part of this rule. Even if you see that currencies included in the pairs are both strong, but the pairs usually move in opposite directions, don't open the same trades.
- Diversify. The currency strength indicator can help you diversify your portfolio. You can open a trade with a currency that is losing its strength and open an opposite trade with a currency gaining momentum. This strategy doesn't give any guarantees against losses. Still, it can limit them.
Currency Strength Indicator: Is It Worth Using?
The currency strength meter is an interesting tool that can provide additional signals and valuable information on the market direction. Although the indicator can’t give 100% accurate signals, it can become a vital part of your strategy. The main disadvantage of this indicator is the wide variety of its versions. Before you find your perfect option, you will have to try many indicators. Fortunately, there are free versions.
So, to find your perfect tool, we recommend using a demo account. A Libertex demo account can help you practice your strategies using the currency strength meter. The fact that this indicator is customized makes it possible to implement on any trading platform.
Why to trade with Libertex?
- access to a demo account free of charge
- technical assistance to the operator 5 days a week, from 8 a.m. till 8 p.m. (Central European Standard Time)
- leverage of up to 1:600 for professional Ñlients
- operate on a platform for any device: Libertex and Metatrader
FAQ
Let's round up what we have learned in this tutorial.
How Do You Measure the Strength of a Currency?
There are many versions of the currency strength indicator. But usually, they use the 0-10 range to measure the strength, where 10 indicates the strongest currency.
What Is the World's Weakest Currency?
There is no such thing as the world's weakest currency. Every currency can be strong or weak regarding the period and timeframe you use.
How Do You Know If a Currency Is Weak or Strong?
To figure out whether the currency is weak or strong, you can apply the currency strength meter.
How Do You Read Currency Pairs?
Let's consider an example. If the EUR/USD pair rises, it means the EUR is stronger than the USD. Still, it doesn't mean the USD is weak in general.
What Makes One Currency Stronger Than Another?
Currencies represent domestic economies. If the economy is strong and the political situation is stable, the currency will appreciate.
What Strengthens or Weakens a Currency?
There are many factors that can affect the strength of the currency, including economic releases, news, supply, and demand are vital forces of the currency.


