


A point is a very important concept for calculating possible profit or loss in financial markets. When conducting transactions, you need to clearly understand how much one point costs and how your deposit will change if the price goes in one direction or another, for example, 50 or 100 points. This affects not only the choice of a particular currency pair and trading strategy, but also the determining of the volume of the transaction, the permissible degree of risk, setting Stop Loss and Take Profit orders. It is necessary to know the point value in order to calculate the spread value, to understand how much you can earn or lose due to a swap, at what moment Margin Call and Stop Out can occur.
In general, a point is something without which money management is simply impossible.
What Is a Point in Forex
The standard and most common currency for a trader's deposit is the US dollar. And naturally, we need to know how much one point costs in USD. This is the only way we can understand how the fluctuation of quotes will affect the balance of our trading account. And while it is quite easy to calculate everything for Forex pairs such as EUR/USD, it will be more difficult to determine how much a spread or swap is worth in US dollars, for example, for NZD/CHF. Moreover, there are a number of nuances here.
- The first of them is that in Forex, quotes were determined for a very long time with an accuracy of four decimal places (1.0000). And the point represented the smallest possible price change, that is 0.0001. With the development of computer technology in recent years, prices have been quoted with an accuracy of five digits (1.00000). It is clear that this option is more accurate, which saves the trader's money. But the step of 0.00001 has become the minimum price change. This has caused some confusion. And in order to somehow avoid it, a number of sources have started to call points in four-digit quotes “old”, and those in five-digit quotes - “new” or “micropoints”. Also, the fifth decimal place is called a tick.
- The next nuance. You can see not only the term “point” In texts dedicated to Forex, but also pip. There is no obvious difference between them. Pip is an abbreviation of the English expression "Price Interest Point" (price change point) and this term refers to the "old" points. Thus, 1 point (or pip) on Forex is the minimum step by which the price of the exchange rate can change upward or downward in four-digit quotes of pairs such as EUR/USD, that is, 0.0001.
- Adding to the confusion is the fact that quotes for different pairs may look different. For example, opening a trade on EUR/USD or USD/CNH, we will see one digit before the decimal point and five digits (decimal places) after it (1.11345 and 6.37495, respectively), and the USD/CHF quote will look like 0.92351. Let's call it the X.YYYYy format. The picture for such pairs as, for example, USD/JPY or CHF/JPY will be completely different: there will be three digits before the decimal point and three after it (122.739 and 131.617, respectively). We will call this format as XXX.YYy.
As mentioned above, one point is 0.00010 for X.YYYYy format pairs. That is, if the quote of the EUR/USD pair has changed from 1.10000 to 1.10010, it is considered that it has passed 1 point. And if, for example, the quote has changed from 1.10750 to 1.11000, it means that it has risen by 25 points. The same is true for the reverse movement: if the quote has changed from 1.10000 to 1.09000, it means that the price has fallen by 100 points.
As for the XXX.YYy format, in this case 1 point is the value of 0.01. That is, if the quote has gone from, say, from 120.250 to 120.750, this means that the movement was 25 points.
What a Lot Is and What Base and Quote Currencies Are
In addition to the point, we will also need to use such a value as a lot in the calculations. A lot is a unit of trade volume that is always 100,000 units of the base currency. The base currency is the one that comes first in the pair. It is it that the trader sells or buys in exchange for the quote one. For example, a quote of 1.1020 for the EUR/USD pair means that the current value of 1 EUR (base currency) is equal to 1.1020 USD (quote currency). Thus, the cost of 1 lot (100,000 EUR) in this case will be 110,200 USD.
At first glance, it seems that a position of 1 lot is very large, but do not forget about the leverage. For example, at the NordFX brokerage company, it can reach the value of 1:1000 at the trader's request.
Thus, to open a position of 1 lot in the EUR/USD pair, with a leverage of 1:1000, you will need a deposit 1000 times less than the cost of the lot, that is, 1.102 USD. And you will need to have 11.02 USD to open the minimum possible trade of 0.01 lot. (This is in theory. In practice, in all cases, it is necessary to take into account the additional costs of the spread or commission, as well as the fact that the trade may go against the position you opened).
Calculating the Point Value for Different Types of Pairs
So, how do you calculate the value of 1 point? (Recall that we are talking about "old" points - 0.0001. The price of 1 unit will be 10 times less for "new micropoints"). The calculation formula looks like this:
(Position Volume × Point) / Quote Currency Rate to USD = Point Value
Option 1. For pairs where the dollar is in the second position, that is, it is the quote currency itself (EUR/USD, GBP/USD, AUD/USD, etc.), the quote rate is 1. Therefore, in calculations, you simply need to multiply the position volume in lots by the point size. For example, you open a position with a size of 0.1 lot, that is, 0.1×100,000=10,000. Then we have:
(10,000 × 0.0001) / 1 = 1 USD
Option 2. For pairs where the dollar is in the first position in the pair, one more parameter is added: the current rate of the quote currency to 1 USD. For example, we open a USD/CAD trade with a volume of 1 lot (100,000 USD) at the current rate of 1.2645. As a result, we have:
(100,000 × 0.0001) / 1.2645 = 7.91 USD
Option 3. For cross pairs that do not include the US dollar, a different procedure for calculating the value of a point applies:
(Position Volume × Point) x Base Currency to USD Rate / Current Pair Rate = Point Value
Let's make a calculation using the example of the GBP/NZD pair for a trade with a volume of 0.1 lot at the current rate of 1.9020 and the GBP/USD base currency rate of 1.3015:
(10,000 × 0.0001) × 1.3015 / 1.9020 = 0.68 USD.
How Trader's Calculator and MetaTrader-4 Can Help
In conclusion, we want to remind you of such a convenient option as the Trader's calculator, which is located in the Tools section on the official NordFX website. You can use it to instantly calculate the cost of one point, find out the size of the spread and swap, as well as the margin requirements for each account type. In just a few seconds, you will not only learn all of these parameters important for trading, but also calculate the size of the expected profit (or loss) for several positions at once. At the same time, the risk of error is reduced to zero, since all the account parameters are already included in the calculator. You will find a detailed description of how to do all this on the same website page.
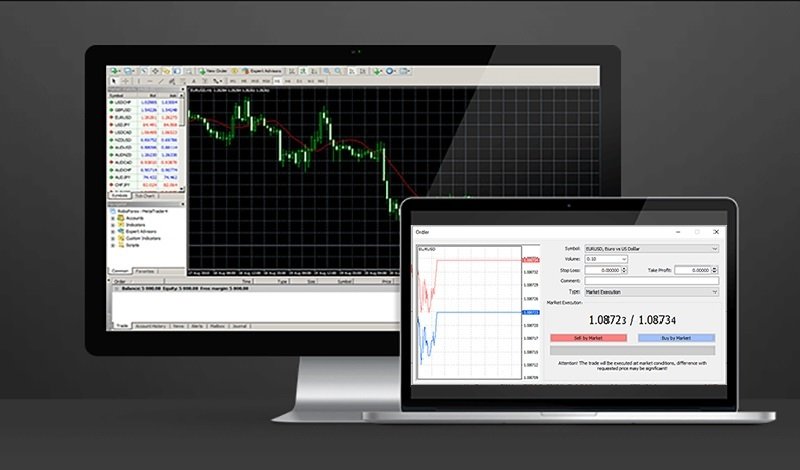
As for the status of the transaction you have already opened, you can follow the current profit or loss in the MetaTrader-4 trading terminal.


