The price of USDJPY on the D1 time frame, was in a short down trend until 23 April when a lower bottom was recorded at 107.477. The bulls refused to sit on the sideline and started entering the market with long positions. After the bottom at 107.477, the market broke through the 15 and 34 Simple Moving Averages and the Momentum Oscillator entered into positive terrain by breaking the zero baseline. This could have warned technical traders that a trend reversal might be on the cards.
A possible critical resistance level formed when a top was recorded on 3 May at 109.696. The bears then tried to push the price lower but a possible higher bottom might be forming near the 15 Simple Moving Average after a support level was touched on 7 May at 108.338.
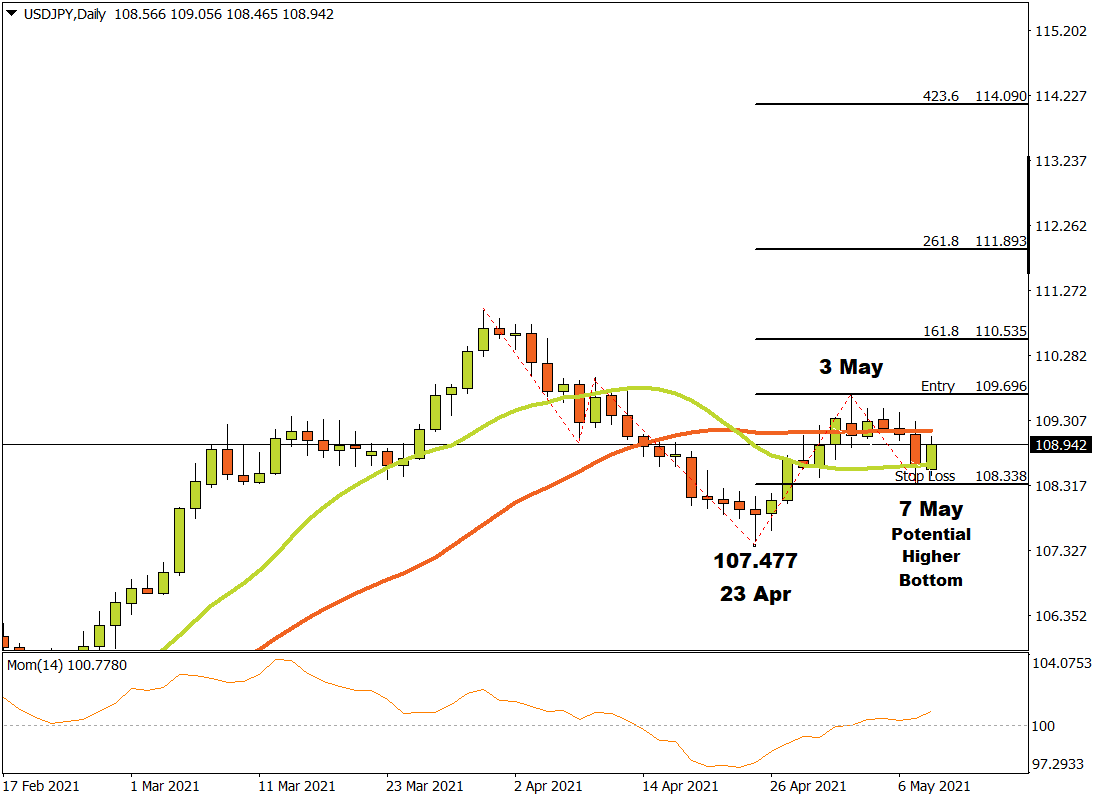
If the USDJPY breaks through the critical resistance level at 109.696, then three possible price targets may be calculated from there. Applying the Fibonacci tool to the top of the resistance level at 109.696 and dragging it to the support level near the 15 Simple Moving Average at 108.338, the following targets might be considered. The first target could be estimated at 110.535 (161 %). The second price target might be considered at 111.893 (261.8%) and the third and final target may be projected at 114.090 (423.6%).
If the 108.338 support level is broken, the anticipated price targets are annulled. As long as the price continues making higher tops and bottoms, thus confirming an uptrend is in place and demand is overcoming supply, the outlook for the USDJPY currency pair on the Daily time-frame will remain bullish.
For more information, please visit: FXTM