The financial sector is one of the largest segments of the S&P 500, according to market capitalization. During the financial crisis of 2008, the US banking stocks were in a fever, many financial institutions were on the verge of collapse. Warren Buffett took advantage of this, investing at the bottom of the market in stocks of Bank of America, Goldman Sachs, etc. Now the Berkshire Hathaway portfolio of shares of public enterprises consists for 40% of securities of the financial sector representatives.
How to evaluate U.S. banking stocks
Since the spring of 2009, when the US stock market turned around, stocks of most surviving US banks rose from the ashes, bearing fruit to the most patient investors. Some of the securities, for example, JP Morgan, managed to update historical highs in 2019, while others have been less successful.
You can invest in stocks of leading US banks even now, but sometimes it is useful to “open shorts”. Technical analysis will provide indispensable assistance in identifying specific areas for opening or closing positions. Evaluation of longer-term trends and the selection of favorites is the task of fundamental analysis, first of all. The analysis of bank stocks has its own specifics, which is why we decided to devote a review to evaluating the securities of this industry.
Revenue metrics
EPS
Earnings per share is a traditional key metric for assessing company earnings. It is the ratio of net profit to the number of shares outstanding. In the event of one-time factors, it is useful to consider adjusted EPS, that is, cleared of one-time income and expenses. The US banks have a lot of such factors, so refined EPS can be very different from the basic version of the indicator.
ROE
Return on equity is the enterprise performance indicator. It is the ratio of net profit to the carrying amount of equity / assets - liabilities. The higher the ROE, the more efficient the business, the ceteris paribus. Moreover, higher return on equity may be due to a higher debt burden (debt / equity ratio). For banks, high debt is the norm due to the structure of their balance sheet. Please note that the former investment banks, Goldman Sachs and Morgan Stanley, have Debt / Equity ratio much higher than their more traditional competitors.
The ratio of loans and deposits
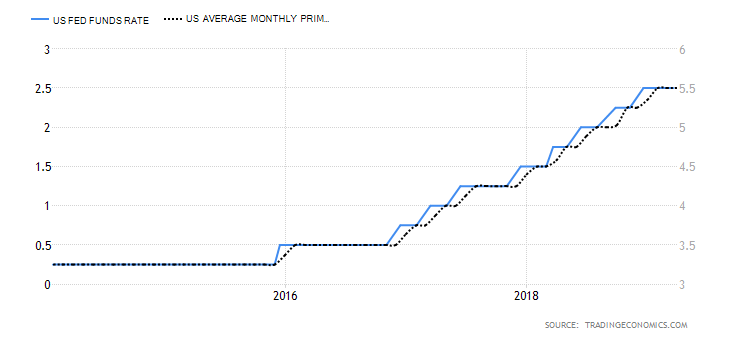
The dynamics of these indicators is important for traditional banks. A combination of a strong economy and fairly low Fed’s interest rates contributes to credit growth, as a rule. The effect intensifies in anticipation of an increase in interest rates, which is especially characteristic of the mortgage segment. The mass of deposits is increasing to a greater extent with a strong economy, but higher interest rates. Bank rates in the United States depend on the prime rate - the rate for high-class borrowers, which in turn depends on the dynamics of the Fed's key rate.
NII
Net interest income is a key metric for assessing the income of financial institutions specializing in attracting deposits and issuing loans. It represents the difference between interest income and expenses. The NII depends on the net interest margin of the bank, which is the difference between the aggregate interest rate on loans and deposits. Balances of the US banks are often designed so that with the growth of the Fed rates, and hence the growth of market interest rates, the NII increases. That is why US banking stocks are considered to be the beneficiaries of the Fed’s rate hike. These stocks often correlate with the dynamics of Treasuries yields. However, an increase in Fed rates could lead to a weakening economy, which is reflected in the flatter or even inverted “yield curve” of the Treasuries. This is already negative for the net interest margin, and hence the NII factor.
The revenue of the FICC division - bonds, currencies, commodities
These are trading indicators in various segments. They are important for evaluating, first of all, former investment banks, although in the event of clear trends, they are also paid attention to in the process of evaluating more traditional financial institutions. These indicators are significantly affected by the volatility of certain exchanges and the level of stress in the financial system. At the same time, a too volatile or too calm market may turn out to be negative.
Efficiency Ratio
This is the ratio of operating expenses and bank revenue. For US financial institutions, a value of 50% or less is considered normal.
Risk indicators
CAR
Capital Adequacy Ratio is the ratio of the amount of capital of level 1 and 2 to risk-weighted assets. The higher the credit risk, the higher the correction factor for assets. For example, loans to government agencies can be almost not taken into account, and mortgage loans are taken at full cost. Tier-1 Capital (level 1) represents the basic capital / the amount of equity, intangible assets and audited reserves. This is a basic airbag that can mitigate losses. Tier-2 Capital (2 levels) is the amount of unaudited retained earnings, unaudited reserves and the main reserve for losses. It can be used to mitigate the effects of more significant losses, in case of loss of Tier 1 capital.
Requirements of banking regulators to provide a financial institution with a minimum level of CAR is necessary to reduce private and systemic financial risks. The standard for Basel II is at least 8%, for Basel III is at least 10.5%. The Basel III standard was developed as a result of the 2008 crisis in order to prevent similar situations. The global banking system plans to fully switch to this standard in the nearest future.
Risk indicators in certain areas: delinquency in various segments, growth of low-quality loans / subprime debt, an excessive increase in the volume of loans with a floating rate, possible “bubbles”.
Dividends and buybacks
Dividend payments in the case of the largest US banks are now quite moderate, dividend yield is about 2% per annum. Payments are usually done quarterly. In addition, leading US financial institutions are implementing stock repurchase programs.
It makes sense to pay attention to the level of dividend payments from net profit. Ideally, for cyclical sectors, which include banks, it should not exceed 50-60%. In the case of systemically important financial institutions, the Fed carries out stress testing, assessing how banks can withstand adverse changes in economic conditions, including all kinds of shocks. Since 2019, the regulator has slightly relaxed supervision, now the US banks with assets of over $250 billion are being evaluated according to strict criteria. When passing stress testing, banks receive approval for the declared dividend payment and share buyback programs.
Investment Valuation Approaches
A classic model in the framework of the cash flow discounting approach is the dividend discount model (DDM). With its help, based on the expected dividend flow, some conditionally fair share price is calculated.
A simpler and rougher approach is multiplier estimation. Two multiples - P / E (price / net profit) and P / BV (price / net value of balance sheet assets) are traditionally used for banks. In addition, the indicator P / TBV (price / net worth of tangible balance sheet assets), as well as forward multipliers, taking into account expectations for income or balance sheet indicators, are used.
If the multiples of the bank exceed the median values for the group of analogues, then this indicates the comparative "high cost" of its shares, and vice versa. This is true "ceteris paribus", that is, if the financial performance of the bank does not exceed the average value for competitors. Equally too low multiples may indicate not the “cheapness” of stocks, but weak financial indicators of the financial institution.
There is also a PEG multiplier - this is P / E, adjusted for EPS dynamics expectations. Ceteris paribus, a PEG value of 1 or lower suggests buying shares.
What stocks of the US banking industry are to watch for during COVID-19 pandemic?
The economic shock caused by the COVID-19 pandemic hit the securities of leading US banks. During the recovery of the US stock market, the financial sector became an outsider.
While S&P 500 is down just 6% since the beginning of the year, SPDR S&P Bank ETF is almost 30% away from the levels of early January 2020.
In this study, we will assess the situation in the US banking industry and draw conclusions on the securities of leading financial institutions. The selection includes JP Morgan (JPM), Bank of America (BAC), Citigroup (C), Wells Fargo (WFC), Goldman Sachs (GS), Morgan Stanley (MS). The shares of these banks are traded not only on the NYSE, but also on most global exchanges.
General trends
Revenues
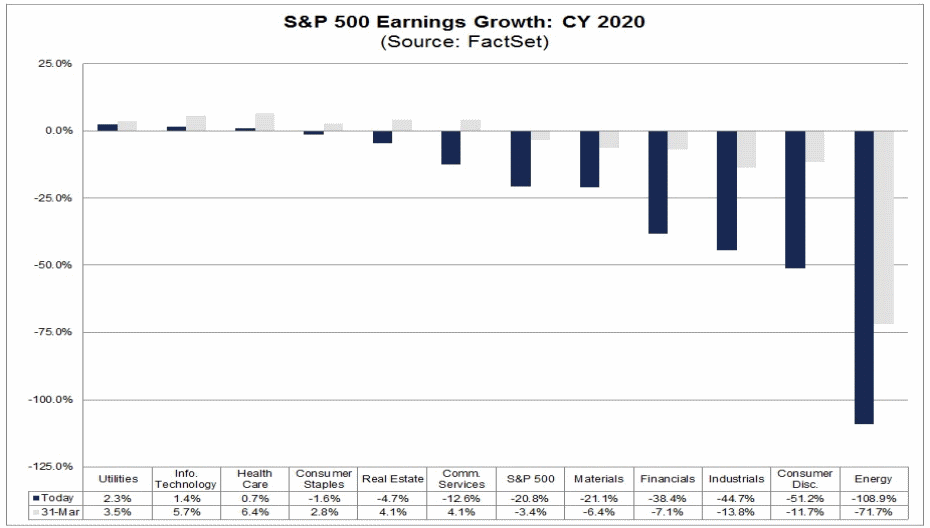
In the first quarter, when the coronavirus COVID-19 pandemic and recession were just starting, net income per share of the US financial sector decreased by 44% compared to the same period last year. Consolidated EPS banking industry fell 63%. An interesting point is that strong volatility in financial markets in March 2020 increased revenue from trading operations of the Top-5 US banks by 30%.
The financial sector has become one of the two outsiders among the S&P 500 companies. The consolidated earnings per share of the S&P 500 fell “only” by 14.6%.
In the second quarter, the situation may come up: -51% against -43%, according to the FactSet’s forecast. The consolidated EPS of the financial sector may reduce by 38% by the end of 2020. A serious improvement is expected in 2021, according to the basic forecast, which implies a U-shaped economic recovery.
Lending
US GDP fell by 5% (q / q) in Q1, 2020. Estimates for the second quarter 2020 vary and suggest a fall from 20% to 40%. Unemployment can grow up to 25%. This is an obvious negative factor for banks.
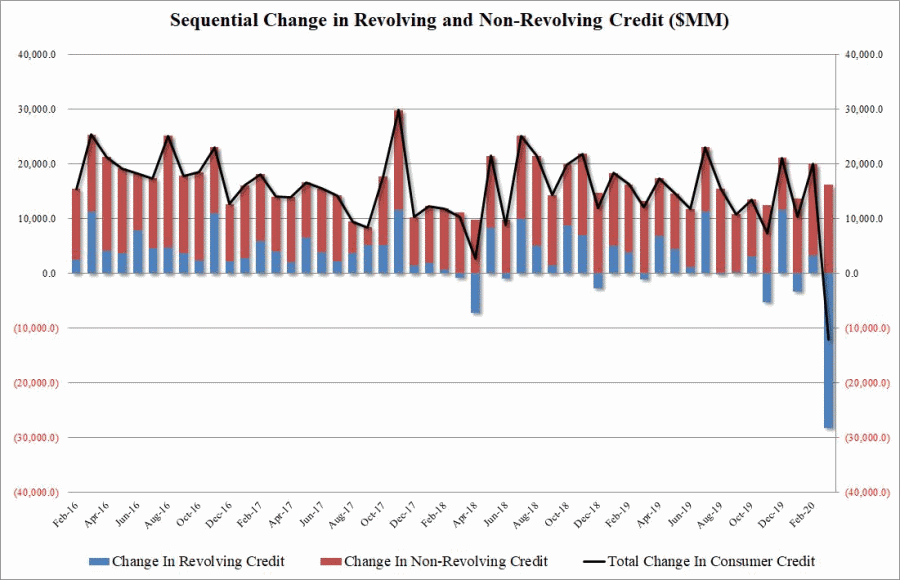
In March 2020, the volume of consumer loans in the US fell by a $12 billion, which is a historic minimum. The situation has not changed much in the conventional lending segment. Credit card lending has decreased significantly. The consumer sentiment has worsened, the US citizens started to save. The situation is better in the corporate segment, as industrial companies turned to credit lines because of liquidity problems.
Interest rates
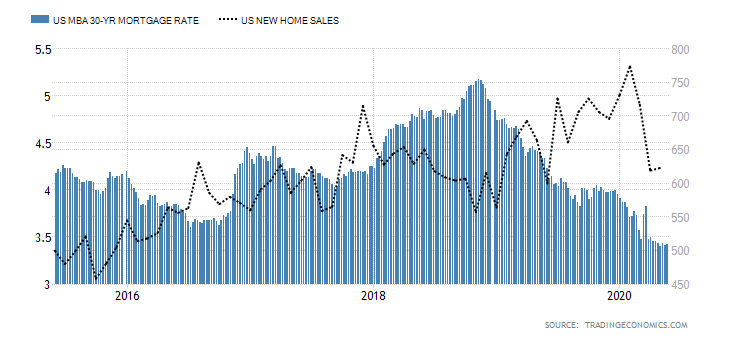
In March 2020, the Fed lowered its key rate to close to zero. The lending rate for first-class borrowers (Prime Rate) fell from 4.75% to 3.25% in 2020. The rate on a 30-year mortgage is now 3.4%. Despite this, the economic downturn and self-isolation measures have worsened the situation in the mortgage segment. Sales of new buildings decreased by another 6.2% (YoY) in April 2020.
In theory, low interest rates are positive for bank income in terms of lending. In fact, due to the structure of balances, interest margin may decrease, which means net interest income. The US banks, as a rule, attract long money as deposits, and issue shorter money as loans. When the Fed lowers the rate, short rates are reduced first and the spread / margin narrows. The experience of the ECB negative rate has shown that this approach creates risks for the banking system.
Risks are reserves
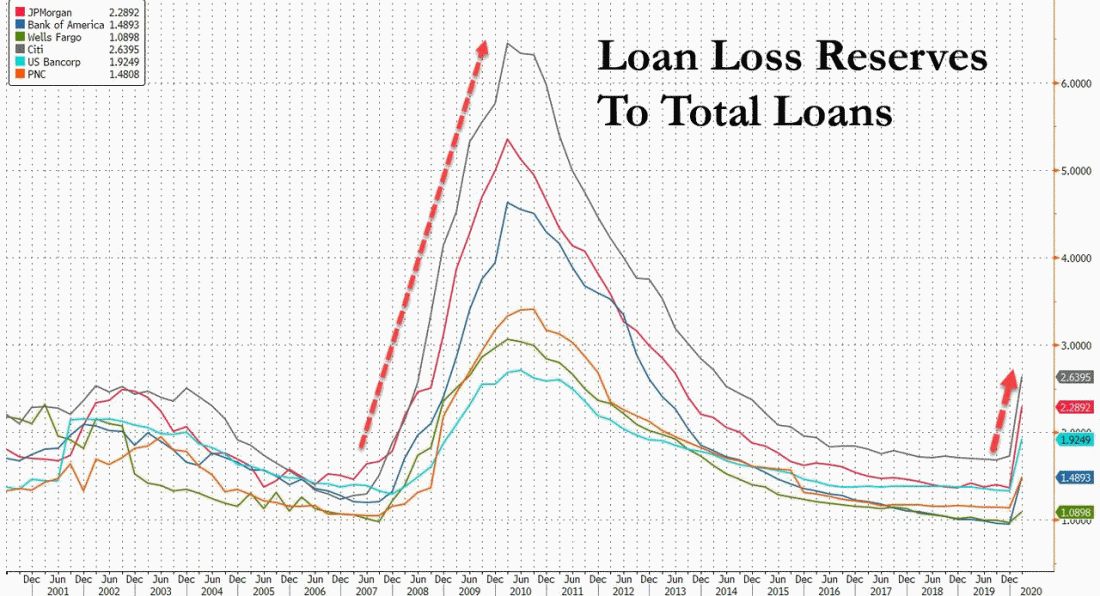
The quality of loans issued has deteriorated, the number of delinquencies and defaults has increased. The situation is especially acute for oil and gas companies and the service sector. In the first quarter 2020, seven leading US banks reserved $27 billion for possible loan losses. This is four times the figure for the entire year 2019. However, the ratio of reserves for possible losses under loans and total loans amounted to 1.5-2.5%. This indicator was 4-6% during the mortgage crisis. Given the situation in the economy, the reserves may increase 3-4 times before the end of the year.
Dividends and buybacks
Last year, leading US banks bought back $110 billion of their shares. At the peak of the collapse of financial exchanges in March 2020, banks turned to the Fed’s discount window for liquidity. It was decided to suspend buybacks. The largest US banks have decided to keep dividends so far. The Fed, which regulates the industry, has already been criticized by the public for allowing this. In the eurozone and the UK, key banks have suspended the payment of dividends. However, the structural problems there are much more serious, they were even there before the crisis.
Financial performance
In the first quarter 2020, adjusted earnings per share and net interest income of leading US financial institutions declined. Wells Fargo, the US market leader in mortgage lending, was particularly hit. JP Morgan ranks first in terms of return on equity (ROE, net income / equity) and size of assets.
If you look at the dynamics of earnings per share excluding one-time factors over four years, then WFC is also an outsider. Bank of America and Morgan Stanley look relatively stable.
An interesting point is that the Refinitiv forecast assumes that in the next 5 years earnings per share of Wells Fargo will increase by 5.7% on average per year. Citigroup and Morgan Stanley are outsiders for this indicator, -10.6% and -0.4% respectively.
In terms of risks, the largest reserves for possible losses on loans are allocated by JP Morgan and Citigroup, $8.3 billion and $7 billion respectively. These banks have the highest ratio of reserves to total loans - 2.3% and 2.6% respectively.
Conclusion 1
So far, according to the set of factors, Goldman Sachs and Bank of America look the best.
Multiplier Score
In the comparative assessment of banks, as a rule, three multiples are used - P / E (capitalization / profit), P / B (capitalization / cost of equity), P / TBV (capitalization / cost of equity less intangible assets).
If you look at the indicators taking into account the data of the last 12 months, then Citigroup and Wells Fargo are the “cheapest” ones, which is quite justified by weak financial indicators. Citigroup has particularly low multiples. JP Morgan is traditionally the most expensive.
For forward multipliers, taking into account income expectations, the situation is generally similar.
Conclusion 2
If you look at how low the multiples are justified by weak financials, Goldman Sachs looks optimal. Citigroup stocks are characterized by extremely low multiplier values, so you can look at them adjusted for increased risks.
Possible growth potential
Let’s evaluate the growth potential of the stocks for 12 months from the point of view of the median targets of analysts. According to the close of trading on May 28, 2020, Citigroup has the highest potential (+ 15.9%), JP Morgan and Morgan Stanley (+ 3.6%) have the smallest potential.
Final Conclusion
In the second quarter 2020, the recession in the United States intensified. Smooth recovery may begin in the second half of the year. A weak economy and near-zero interest rates affect adversely the business of banks. Leading financial institutions are forced to reserve billions for possible losses on loans.
Multipliers of bank stocks smoothed, but lower values are justified by weak financial indicators. The technical picture indicates a high probability of a new drawdown in bank securities.
By a combination of factors, Goldman Sachs and Citigroup are worth mentioning as potentially interesting stories. As to GS, it would be worth waiting for drawdowns in the region of $180. As to Citigroup, it makes sense to wait for $43-42.