Gold's resurgence beyond the coveted US$2,000 threshold signals a notable shift in market sentiment, coinciding with the US dollar's stumble, which is headed for its most significant monthly retreat in over a year. This shift is fueled by market speculation that the Federal Reserve may consider interest rate cuts in the upcoming year. However, such speculation may be premature, as the Fed has not explicitly signaled any impending rate reductions.
Key Economic Events to Watch
- EU Inflation Data: The release of EU inflation figures on Thursday is expected to influence the EUR/USD pair, potentially amplifying the divergence in monetary policy between the European Central Bank (ECB) and the US Federal Reserve.
- Fed Chair Jerome Powell’s Address: Jerome Powell's address on Friday is highly anticipated for insights into the Fed's policy trajectory. While there is hope for clarification on rate movements, the absence of concrete details could have significant implications for both the US dollar and gold prices.
Technical Analysis: Interpreting Gold's Elliott Wave Chart
- Elliott Wave Projections: The Elliott Wave indicator on the XAU/USD chart projects a neutral to bullish outlook, suggesting that there are still phases within the current cycle that remain to be completed.
- Potential Price Targets: Assuming the Elliott Wave cycle unfolds as anticipated, we could observe gold reaching multi-month highs above US$2,020, echoing previous peak levels.
- Support and Resistance Thresholds: Pullbacks are anticipated slightly below the US$2,000 mark, indicating that this price level will be a key focal point for market participants in the near term.
Analyzing the Chart
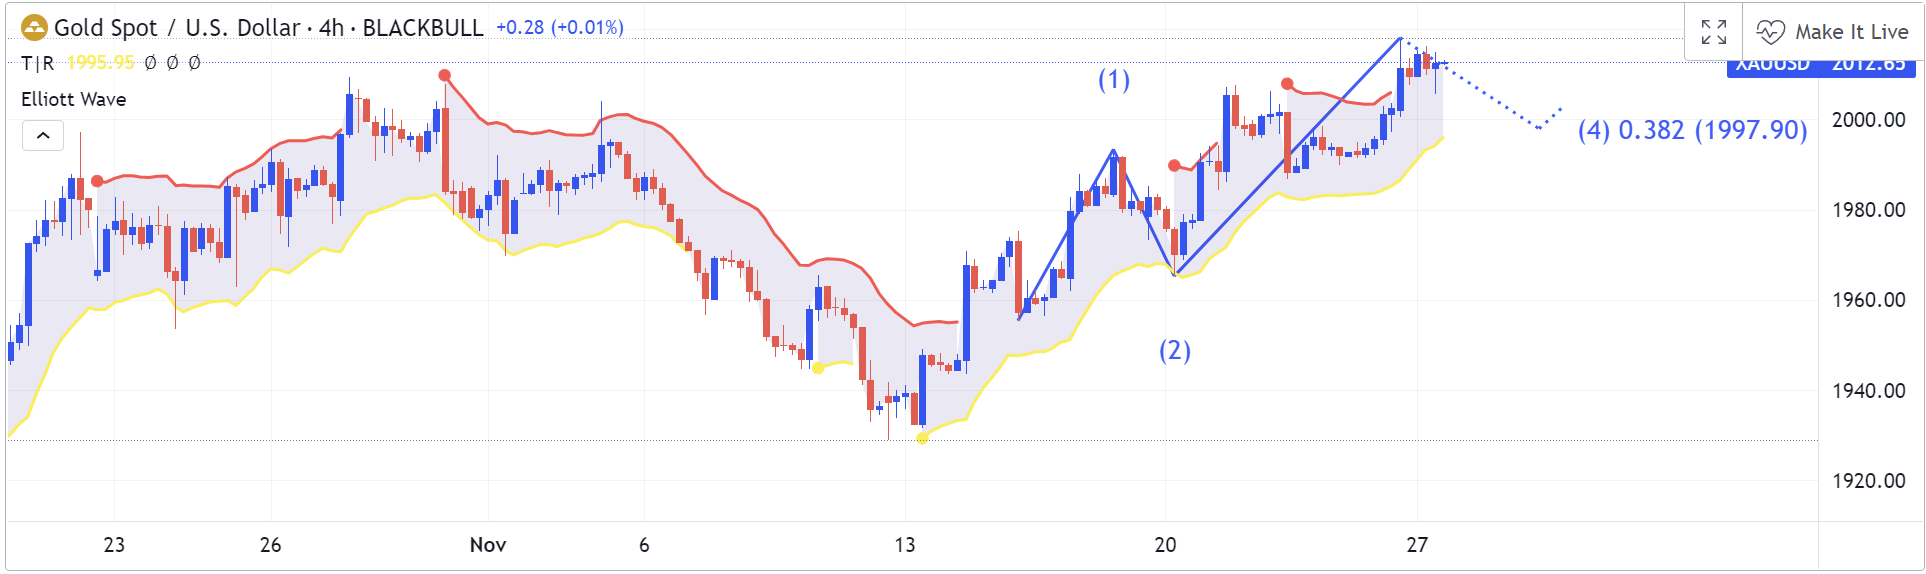
The 4-hour chart for Gold spot versus the US dollar, denoted as XAU/USD, showcases the price action encompassing Elliott Wave patterns. The chart indicates:
- Elliott Wave Counts: Waves (1) and (2) show a completed cycle, with wave (3) demonstrating a strong bullish impulse. The current formation suggests the beginning of wave (4), a corrective phase that could potentially retrace to 38.2% of wave (3) near the 1997.90 price level, as denoted by the dotted blue line.
- Bollinger Bands: The price is oscillating within the upper half of the Bollinger Bands, signaling potential overbought conditions. However, the bands are widening, which could mean increasing volatility and potential for further price ascension.
- Support Levels: Should the corrective wave (4) materialize, the key support zone near the lower band and previous wave (2) around 1960 could serve as a robust floor for prices.
Gold's Position Amid Economic Uncertainty
In the context of upcoming economic events and technical indicators, gold's outlook is cautiously optimistic. Market participants will be closely monitoring the EU inflation data and Powell’s address for directional cues. The technical setup, coupled with the underlying economic narratives, suggests a continuation of the bullish trend, with an eye on the psychological and technical level of US$2,000 as both a support and a pivot point for future price movements.