


Technical indicators are calculations derived from price and volume data. They have plotted either as overlays on a price chart or below a price chart. Indicators are used by technical analysts and traders to identify what may happen in the future and to identify potential trading opportunities.
Technical indicators can be applied to the charts of currencies, stocks and any other tradable asset on any time frame. Most indicators have standard parameters which can be adjusted to suit the strategy being used.
Over 100 indicators are available on most charting platforms, which often also allow users to create their own indicators. It is usually best to stick to just 3 or 4 indicators that you feel comfortable with to avoid overcomplicating matters. This tutorial covers the most popular, widely used indicators.
Broadly speaking, technical indicators can be divided into six categories, although many fall into more than one category.
Moving Averages and Trend Indicators
Moving averages are perhaps the simplest of indicators, consisting of a running average of the prices over the previous X number of periods. Moving averages can provide clarity when the price action is too volatile to make sense of trends.
The direction of a moving average can be used to identify the direction of the trend. Or, several moving averages can be used together to identify short-term, medium-term and long-term trends. Moving average crossovers can also signal changes in trend.
Because moving averages use historical data, they lag the price. For this reason, many analysts prefer exponential moving averages which give more weight to prices that are more recent.
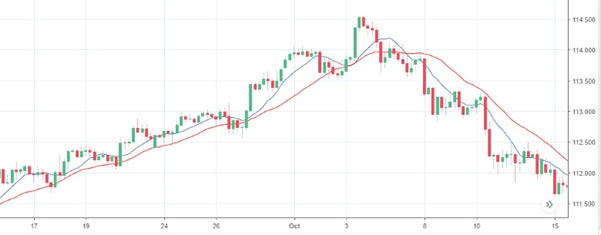
USDJPY price chart with two moving averages
Several other indicators can be used to identify the direction and strength of a trend. These include:
- Parabolic Stop and Reverse indicator (SAR)
- Average Directional Index (ADX)
- Moving Average Convergence Divergence (MACD)
- On Balance Volume (OBV)
Price Bands
Price bands use moving averages and various measures of volatility to construct bands above and below the price on a chart. These bands envelope most of the normal price behaviour, with prices only moving outside the band briefly or when strong trends develop.
They can be used to identify the type of market, whether volatility is rising or falling and likely support and resistance levels.
Bollinger Bands are the most widely used type of price band. They are constructed by adding and subtracting the standard deviation of price changes to a moving average. They are used in numerous ways for both mean reversion and breakout trading strategies.
Other types of price bands include:
- Keltner bands which use the average true range rather than standard deviation.
- Percentage price bands which use a fixed percentage of the price to set the width of the bands.
- Donchian channels which use the highest and lowest price over a specific period to define the bands.
Oscillators
Oscillators are constructed using formulas based on price data over a specified period. They are designed to oscillate between two values, usually either -100 and +100 or 0 and 100 / -100.
Oscillators are plotted below a price chart and used to indicate potentially overbought and oversold situations, potential changes in price direction, and to confirm entry and exit decisions.
The Relative Strength Index, or RSI, is perhaps the most widely used oscillator. It is calculated using the ratio of higher closes to lower closes. The RSI is usually calculated using the previous 14 periods of price data, but traders sometime adjust the period to 2, 5, 21 or other numbers preferred by the trader.
If the RSI is above 50, momentum is said to be up, and below 50 it is said to be down. Divergence between the price and the RSI often warns of a pending change in price direction. It can also be used to indicate overbought and oversold levels.
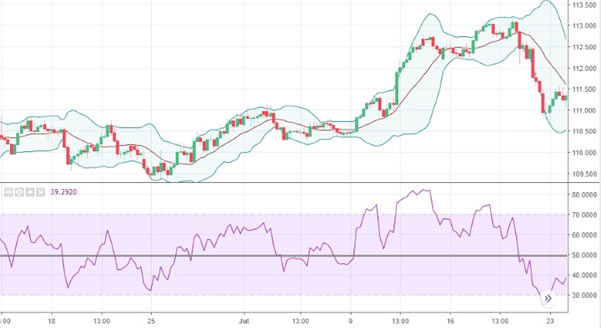
USDJPY price chart with RSI and Bollinger Bands
Other widely used oscillators include:
- Stochastic indicators
- The Commodity Channel Index (CCI)
- Moving Average Convergence Divergence (MACD)
Momentum Indicators
Momentum indicators give traders an indication of the strength of a trend. Most oscillators can be used as momentum indicators as can some trend indicators.
The Rate of Change (ROC) and Momentum indicators are almost identical. They track the most recent closing price as a percentage of the close X periods earlier and oscillate between -1 and 1. Momentum is positive above 0 and negative below 0, but this always depends on the period being studied.
Some other already mentioned indicators that can be used to gauge momentum are the RSI, ADX, and MACD.
Volume Indicators
Volume-based indicators combine price and volume data to indicate whether money is flowing into or out of a market. They are often used to confirm trading decisions as high-volume price moves are regarded as more reliable than low volume moves. Volume indicators are only applicable to markets where volume is reliably recorded and are therefore seldom used for forex trading.
The On Balance Volume indicator, or OBV, simply records a running total with volume added on up days and subtracted on down days. Divergence between price and the OBV can warn of changes in trend and it can be used to confirm the start of a new price trend.
Other volume indictors include:
- Money Flow indicator (MF)
- Price Volume Trend indicator (PVT)
- Accumulation/Distribution index
Volatility Indicators
Markets tend to cycle between periods of rising and falling volatility. Volatility indicators can give traders an idea of when to expect a range bound market or a trending market.
The Average True Range indicator, or ATR, averages the true range over 14 periods. The true range for each period is calculated by taking the greater of the current days range, the current high minus the previous close, or the previous close minus the current low.
The ATR can be compared to historical levels to anticipate a breakout or periods of consolidation. It can also be used to confirm momentum trades.
Other volatility indicators include:
- Standard Deviation
- Bollinger Bands
- Keltner Bands
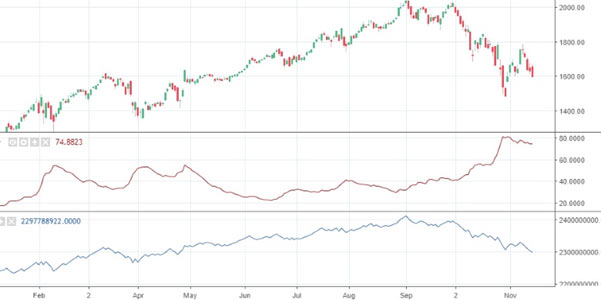
Amazon price chart with OBV and ATRm
Conclusion
Technical indicators can be used in numerous ways to analyse markets, build trading strategies and confirm trade signals. However, they should always be used in conjunction with the price action and not in isolation.
Further tutorials in this series will discuss each indicator in more detail, and how they can be used to identify trading opportunities.


