


 Written by
 In the world of forex trading, understanding price movements is paramount. Forex charts serve as the canvas upon which traders analyze historical and current price data to make informed decisions. This article serves as a beginner-friendly guide to reading forex charts, deciphering candlestick patterns, and utilizing technical indicators to navigate the complexities of the market.
Understanding Forex Charts
Forex charts visually represent the price movements of currency pairs over specific timeframes. There are various types of charts, but the most commonly used are line charts, bar charts, and candlestick charts. Candlestick charts, in particular, are renowned for their ability to convey a wealth of information in a single candle.
Decoding Candlestick Patterns
The Basics of a Candlestick: Each candlestick consists of a body and wicks (also known as shadows). The body represents the opening and closing prices, while the wicks extend above and below the body, indicating the high and low prices during the timeframe.
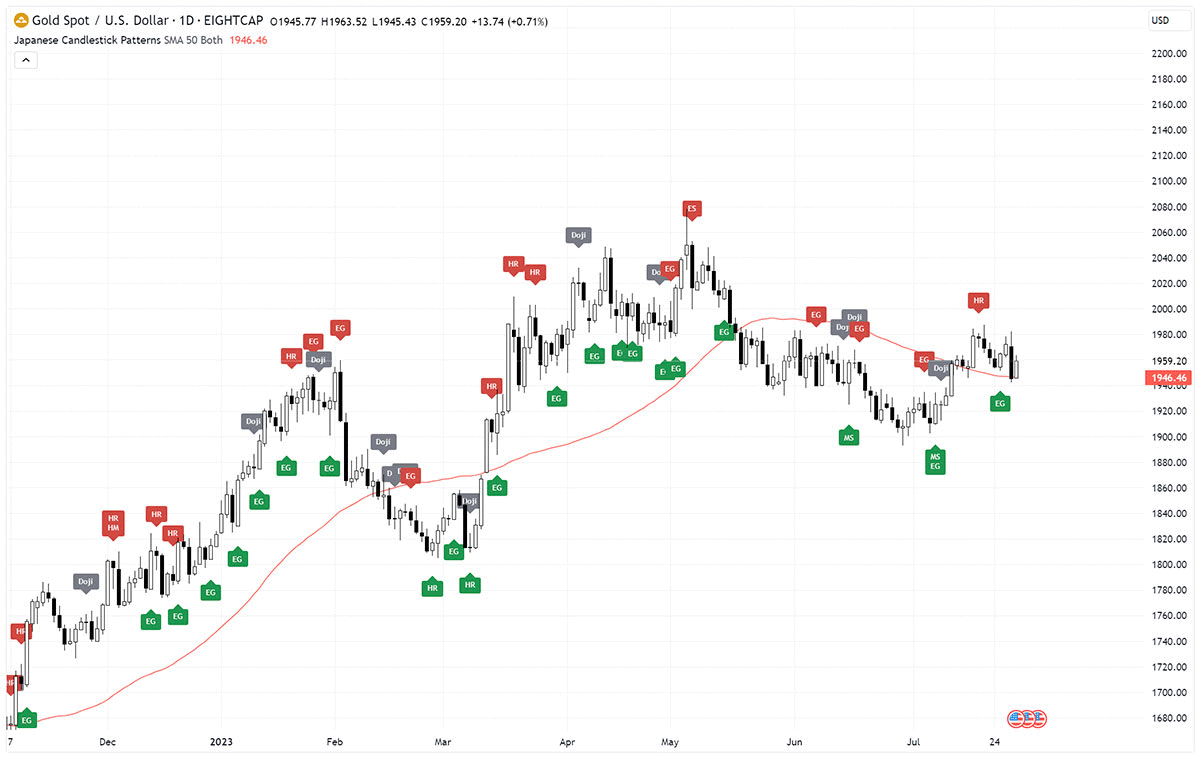
Japanese Candlestick Patterns
Bullish and Bearish Candles: Bullish candles have a higher closing price than opening price, signifying buying pressure. Conversely, bearish candles have a lower closing price than opening price, indicating selling pressure.
Candlestick Patterns: Patterns formed by candlesticks provide insights into potential price movements.
Examples include:
- Doji: Indicates uncertainty in the market and potential reversals.
- Engulfing Patterns: Signals trend reversals when one candle engulfs the previous one.
- Hammer and Shooting Star: Suggest potential reversals based on their position within a trend.
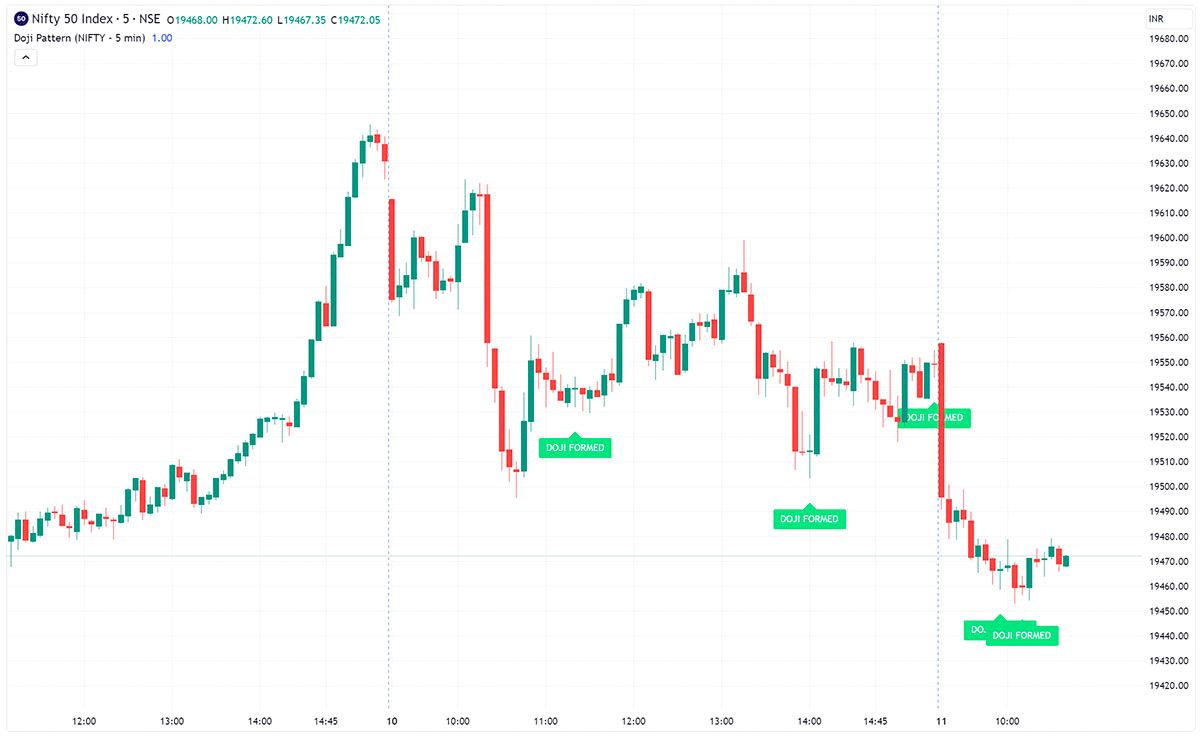
Doji Candle Indicator
Using Technical Indicators
Technical indicators are tools that help traders interpret price data and forecast potential future movements. Here are a few commonly used indicators:
- Moving Averages: Moving averages smooth out price data and help identify trends. The simple moving average (SMA) considers equal weight to each price point, while the exponential moving average (EMA) gives more weight to recent prices.
- Relative Strength Index (RSI): RSI measures the speed and change of price movements. It ranges from 0 to 100 and helps identify overbought and oversold conditions.
- Bollinger Bands: Bollinger Bands consist of a middle line (SMA or EMA) and two outer bands that represent standard deviations. They indicate volatility and potential price reversals.
- MACD (Moving Average Convergence Divergence): MACD helps identify changes in momentum by comparing two moving averages. It includes a MACD line, signal line, and histogram.
Making Informed Trading Decisions
- Identifying Trends: Recognizing the direction of the trend (upward, downward, or sideways) is essential. Technical indicators can help confirm trends.
- Confirming Patterns: Candlestick patterns are more powerful when confirmed by other technical tools or indicators. This reduces the likelihood of false signals.
- Managing Risk: Technical analysis aids in determining entry and exit points, helping traders implement effective risk management strategies.
- Combining Analysis: Successful traders often combine technical analysis with fundamental analysis to make comprehensive trading decisions.
Reading forex charts is an art that requires practice, observation, and continuous learning. Understanding candlestick patterns and utilizing technical indicators provide traders with valuable insights into price movements. While technical analysis is a powerful tool, it's important to remember that no method guarantees success. Traders should approach the market with caution, discipline, and a solid understanding of both technical and fundamental factors to make informed trading decisions.


