The high volatility created by the mini-crisis in the banking sector appears to have diminished and gold’s price has remained relatively unchanged from last week. Following gold’s rapid ascent to the heavens after banking fears funnelled inflows into the precious, it now appears that the shiny metal is moving in a sideways motion as the markets await further information. In this report, we aim to shed light on the catalysts driving the precious metal’s price, assess its future outlook and conclude with a technical analysis.
Gold stays near one year highs
The wide uncertainty in the global banking sector appears to have subsided, yet the precious held its ground between last week’s opening and closing range, remaining relatively unchanged. The surprise decision by OPEC+ on Sunday, to reduce their oil production by 1.16 million barrels per day, reignited fears of prolonged inflationary pressures. This serves as a problem for Fed officials as in the previous months, as relatively low oil prices, kept a lid on top of inflationary pressures.
As a result, we may see the impact of the reduction in production cuts from OPEC+, translating into more support for the USD and heightened probabilities for an acceleration of inflationary pressures thus it may lead to further rate hikes by the central bank. Therefore, the prospect of further hikes by the Fed could put pressure on the shiny metal, making it more expensive of overseas buyers, due to its denomination in USD.
Furthermore, yesterday’s US ISM manufacturing data indicated that, the manufacturing sector of the US has been slacking on multiple fronts, such as new orders, employment, prices and activity in general, echoing worries for a severe economic downturn in the US, which increases the probabilities of a recession. The bad round of manufacturing data negatively impacted the greenback, which came under significant pressure and gold capitalized on that very weakness, pared losses and closed strongly in the greens. Also yesterday, St. Louis Fed President Bullard commented on the production cuts by OPEC+, explicitly stating that it makes “the Fed’s job of lowering inflation more challenging”, and signaled that more hikes may be needed to contain the potential increases in petrol prices, which could feed inflationary pressures further.
Even though his tone appeared more hawkish than normal, his comments failed to contain the dollar’s fall and cap gold’s ascent. Going beyond the recent turmoil induced by OPEC+ decision to cut production and the hawkish remarks of Fed President Bullard, the market now increasingly shift its attention towards the main event of the week which is due on Friday. The Non-Farm Payrolls report is expected to be the next big test for the dollar and by extend serves as a catalyst into the future outlook of the precious. Should the NFP figure match expectations for a slowdown to 240k for the 311k jobs created in the prior month we may see the greenback coming under pressure and gold receiving inflows, extending its ascent to higher ground.
Technical Analysis
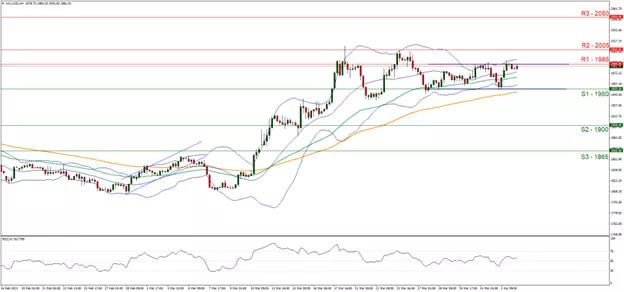
- Support: 1950 (S1), 1900 (S2), 1865 (S3)
- Resistance: 1985 (R1), 2005 (R2), 2050 (R3)
Sideways Channel Analysis and Outlook for Gold’s Price
Gold’s price seems to be moving in a sideways channel since the 27th of March unable to break either above the 1985 (R1) resistance and 1950 (S1) support levels. We tend to maintain a neutral outlook as long as the price action remains between the channel formed between 1950 (S1) and 1985 (R1) levels with the RSI indicator remaining steady near 50. Should the price action breach definitively the resistance line of 1985 (R1) that may allow for gold’s price to test resistance at the 2005 (R2) level marking a break above the upper Bollinger band range thus potentially moving even higher as it may be indicative of a bullish sentiment forming.
For a bearish outlook, we would require price to make a clean break the bellow 1950 (S1) support line, aiming if not breaking also the 1900 (S2) key psychological support level.