As we delve into the intricate world of gold trading, it's essential to understand the dynamic interplay between fundamental factors and technical analysis. Recently, gold has been exhibiting bearish tendencies, raising questions about its future trajectory. This report aims to dissect the fundamentals driving this trend, evaluate the upcoming challenges for the precious metal, and conclude with a comprehensive technical analysis of gold's daily chart.
Fundamental Analysis
- The US Employment Report. The US Dollar found support as the latest employment data outperformed expectations. The Non-Farm Payrolls (NFP) reported a figure of 199k, surpassing the anticipated 180k, while the unemployment rate dropped to 3.7%, defying the forecast of a stable 3.9%. This robust data emphasizes the resilience of the US job market, potentially signaling a firmer stance from the Federal Reserve. As a result, the market's expectation for future rate cuts has adjusted, suggesting fewer cuts than previously anticipated. This scenario could further strengthen the USD, thereby exerting downward pressure on gold prices due to their inverse relationship.
- November’s US CPI Data. This week, volatility in the gold market is expected to persist, especially with the release of the US CPI data for November. Any indication of persistent inflationary pressures could reinforce the Fed's hawkish stance, supporting the dollar and consequently creating bearish tendencies for gold. Conversely, signs of easing inflation could weaken the USD and potentially bolster gold prices.
- The Fed’s Interest Rate Decision. The focal point for gold traders this week is the Federal Reserve's interest rate decision. The market largely anticipates the Fed to maintain rates at 5.00-5.25%, shifting the spotlight to the accompanying statement and Chairman Powell’s press conference. The recent tightening in the US job market, combined with potential persistent inflation, could influence the Fed to maintain a hawkish outlook. However, if inflationary pressures show signs of easing, it might alleviate some of the pressure on the Fed, allowing for a more dovish stance. The upcoming dot plot release will also be critical in shaping market expectations regarding the Fed's future rate trajectory.
Technical Analysis of Gold
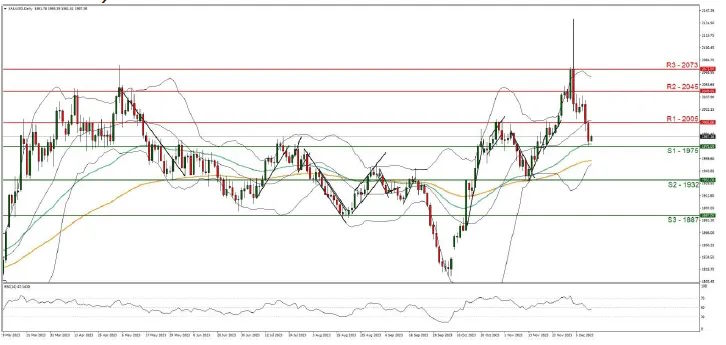
XAU/USD 4-Hour Chart Analysis
As we analyze the 4-hour chart for XAU/USD, we observe a downward movement over the past week, potentially marking a consecutive bearish trend. The RSI indicator, hovering around the 50 mark, indicates market indecisiveness. However, the breach below the psychological level of 2000 suggests a bearish sentiment.
Key Support and Resistance Levels
- Support Levels: The immediate support is placed at 1975 (S1). A further drop could see gold testing the 1932 (S2) support level, followed by the 1887 (S3) level.
- Resistance Levels: On the upside, resistance is found at 2005 (R1). A reversal of the bearish trend could lead to testing higher resistances at 2045 (R2) and 2073 (R3).
Conclusion
In summary, gold's future movement hinges on several crucial economic indicators and the Fed's upcoming decisions. While the bearish trend seems predominant, traders must stay vigilant for any shifts in market sentiment or unexpected economic developments. Gold's journey this week could be marked by sideways movements or continued bearish trends, dictated by fundamental drivers and technical confirmations. As always, staying informed and agile is key in navigating the gold market's complex landscape.