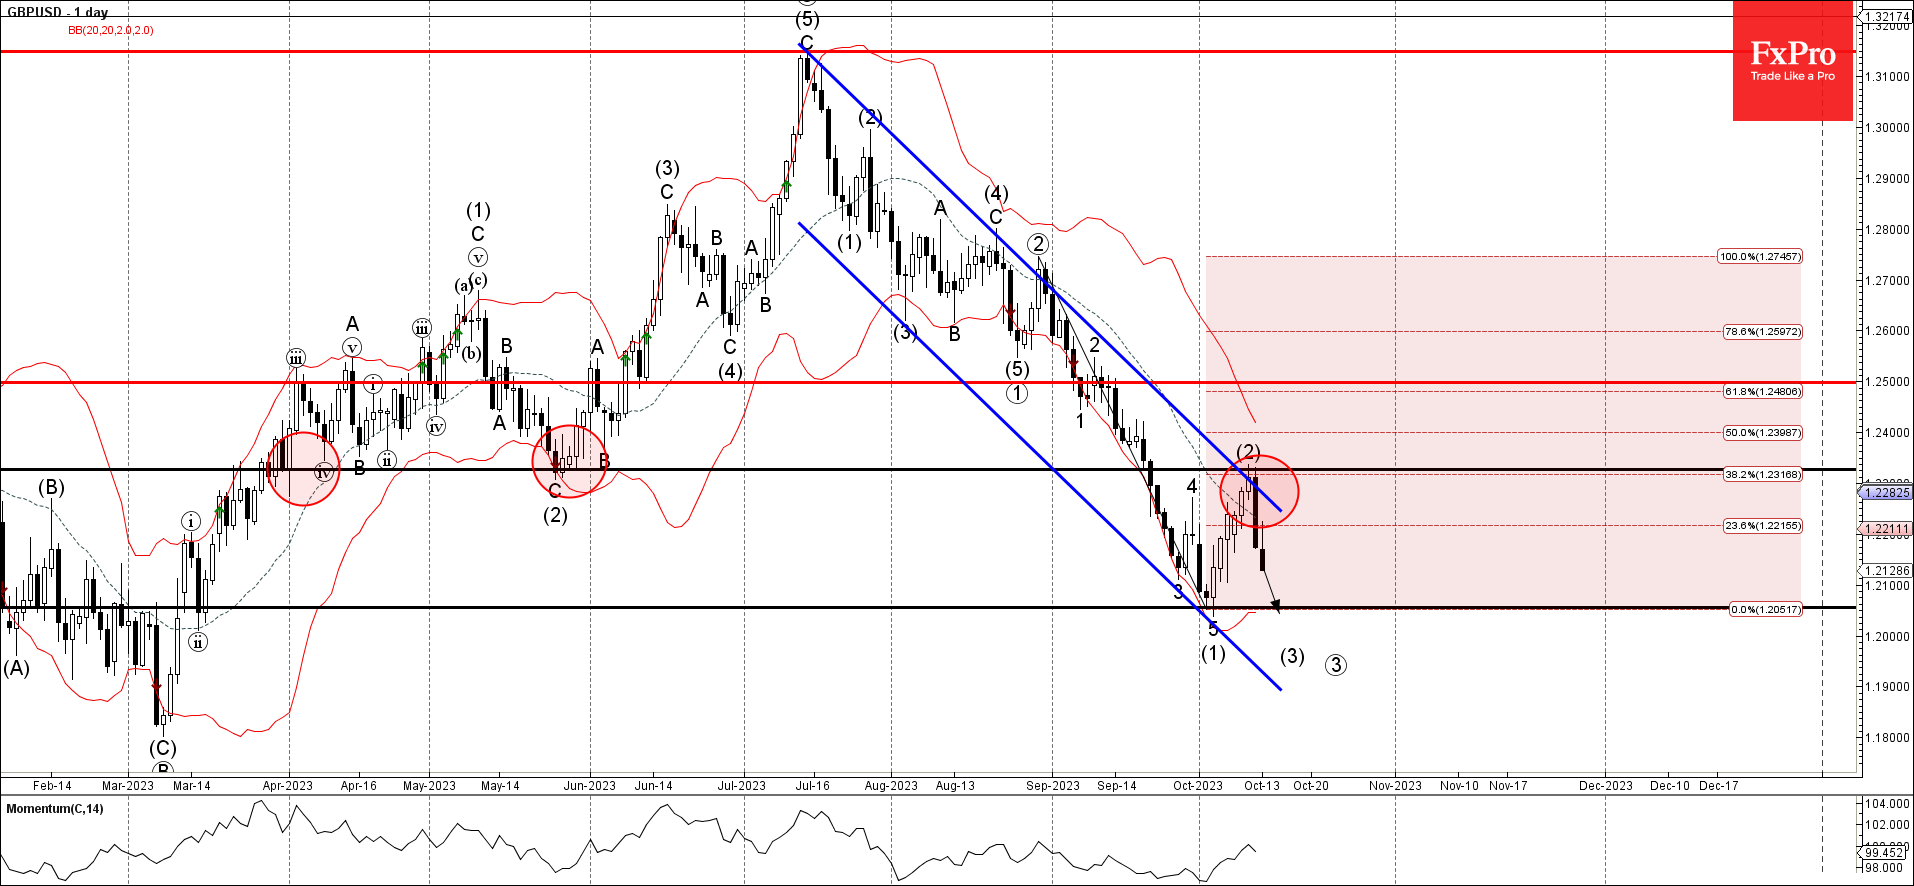
The GBPUSD currency pair, an essential gauge of the British pound's strength against the US dollar, has recently encountered a formidable roadblock at the significant resistance level of 1.2325. Notably, this level has historical importance, having served as a robust support back in May. This resistance is further bolstered by its alignment with the descending trendline, traceable from July's daily charts, reinforcing its critical nature in the pair's price dynamics.
The point of intrigue here is the formation of the 'Evening Star Doji', a notable reversal pattern in Japanese candlestick charting techniques, spotted just as GBPUSD retreated from the 1.2325 mark. For seasoned traders and chartists, this particular pattern can signal a potential trend reversal. In this context, it appears to herald the commencement of an active impulse wave, labeled as (3) in wave analytics.
With the prevailing bearish sentiment surrounding GBPUSD, combined with the technical indicators mentioned above, there's a palpable expectation that the pair may witness further declines. The next critical juncture for traders to monitor would be the support level situated at 1.2055. Intriguingly, this level has historical precedence as it previously arrested the decline of impulse wave (1), indicating its potential significance in the current market landscape.
To summarize, GBPUSD's recent price actions and the emerging technical patterns underscore a potential continuation of the bearish momentum. As always, market dynamics are subject to a myriad of factors, but the immediate focus for traders would be the possible journey of GBPUSD towards the 1.2055 support region.