In analytics, there is a chance you’ll come across the term divergence. Divergence is one of the well-known market conditions that provide reliable signals on the upcoming market direction. Investors like divergence because it can be used both as a signal confirmation and a stand-alone signal. However, like any other technical concept, it has features that should be noticed before you use it. In our tutorial, we will uncover all the secrets of effectively using divergence and applying profitable strategies.
What Is Divergence in Trading: Definition
Divergence is one of the most effective and most common market conditions that provide reliable trading signals on the price reversal and market retracement depending on the divergence type. The concept is simple, and that's why it's loved by traders all around the world. Divergence is a market condition when the price and the indicator diverge or go in different directions. The signal of the upcoming price movement appears from this divergence. The indicator is usually an oscillator placed below the price chart, so you can easily see divergence without applying any additional tools.
Divergence is a market condition when the price and the indicator go in different directions. The signal of the upcoming price movement is read from this divergence.
Divergence should be used to define accurate entry/exit points. It only provides necessary information about the foreseen price direction that can be used to open or close the trade. As divergence provides signals on the price direction, there are different types of divergence you should know about.
Types of Divergences
There are two main types of divergence: bearish and bullish. Along with that, both types have two forms: regular and hidden. Let's consider each type in detail.
When the bearish divergence, we consider extremes of the price. In case of bullish divergence, we look at lows at the price chart.
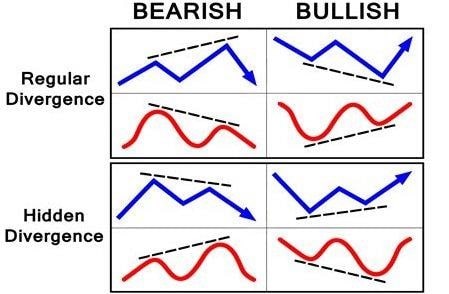
Regular Divergence
Regular divergence is the easiest form of divergence because you can simply find it on the chart. Thus, we will start with it. The idea of regular divergence is to predict a weakening trend and potential price reversal.
The idea of regular divergence is to predict a potential price reversal.
Bullish Divergence
A bullish divergence can also be called convergence. It's a market situation when the price forms lower lows. At the same time, the indicator you chose has higher lows. It's the first signal that traders should bet on the upward rally. You know that indicators are used to predict the price direction. Thus, if the indicator moves upside, it means the price should rise as well.
Bearish Divergence
A bearish divergence happens when the price forms higher highs, but the indicator creates lower highs. Usually, the price goes down after the formation of the bearish divergence. The downward movement occurs as the indicator is more important in defining the upcoming price direction. If it goes down, it's a sign the price will go down.
It may seem challenging to remember all these highs and lows. That's why we give you a hint:
- With bearish divergence, we consider the highs of the price.
- In case of bullish divergence, we look at lows at the price chart.
Hidden Divergence
Hidden divergence is another form of bullish/bearish divergence. The name of this type reflects the main problem a trader can meet with - it's difficult to define it. Hidden divergence is an indicative tool concerning the market correction and continuation of the previous price movement.
Hidden divergence predicts market correction and continuation of the previous price movement.
Hidden Bearish Divergence
Hidden bearish divergence is the market condition when the price forms lower highs, but the indicator creates higher highs. The lack of higher highs on the price chart is odd that bulls are not in force anymore.
We already mentioned that the indicator is the key to the upcoming market direction. However, it's not the case when talking about hidden divergence. Although the indicator forms higher highs and a trader may consider it as a sign of the upward movement, the market has an opposite trend, and retracement will likely occur. Such a signal can be used to open a short position at higher levels.
Hidden Bullish Divergence
Hidden bullish divergence is a market situation when the price has higher lows. Still, the indicator forms lower lows. Although the indicator moves down, a lack of lows on the price chart signals bears’ weakness. We expect the price to retrace. It's a great chance to open a long position at lower levels. It's not easy to keep all these signals in your head. Thus, we created a table that will help you understand the differences. Use the table below to read the signals correctly.
|
Type |
Price |
Indicator |
Signal |
|
Regular: a sign of reversal |
|||
|
Bearish |
Higher High |
Lower High |
Potential reversal down |
|
Bullish |
Lower Low |
Higher Low |
Potential reversal up |
|
Hidden: a sign of correction and continuation |
|||
|
Bearish |
Lower High |
Higher High |
A downtrend is likely to resume |
|
Bullish |
Higher Low |
Lower Low |
An uptrend is likely to resume |
The Best Technical Indicators for Identifying Divergence in Trading
We have talked a lot about indicators but haven't mentioned what indicators are usually used to identify divergence. Of course, not all technical tools will provide divergence signals. We’re going to list the most common and reliable ones. Keep in mind that these indicators don’t only give divergence signals. Still, this tutorial is about divergence, and that's why we will focus on reading divergence signals.
Oscillators are the most reliable technical indicators that can be used to define divergence. MACD, RSI, Stochastic Oscillator, and CCI are among them.
MACD
It doesn't matter if you are a newbie or a professional trader - it’s still worth learning about the MACD indicator. It's one of the easiest technical tools that provide good signals. The MACD indicator is a lagging indicator, which means that its signals occur late. Still, it's an advantage when talking about divergence. The signal that divergence provides will be even stronger.
The idea is similar: all you need to do is wait until the indicator forms highs/lows that will be different from the highs/lows of the price.
We always say that it’s vital to use other technical indicators or patterns to confirm any signal you get. However, the MACD indicator can be used on its own. A crossover signal of the indicator can be used as confirmation if you want to enter the trade based on the divergence signal. If the crossover occurs, it's a sign that divergence works.
RSI
RSI (Relative Strength Index) is an oscillator that is commonly used to depict overbought/oversold market conditions. At the same time, it forms highs and lows and can be simply used for the divergence concept. The RSI indicator is represented by a solid line that moves up and down. The highs and lows of this line are used to find divergence.
Look at the chart below. As you can see, there is bearish divergence between the price chart and the RSI oscillator.
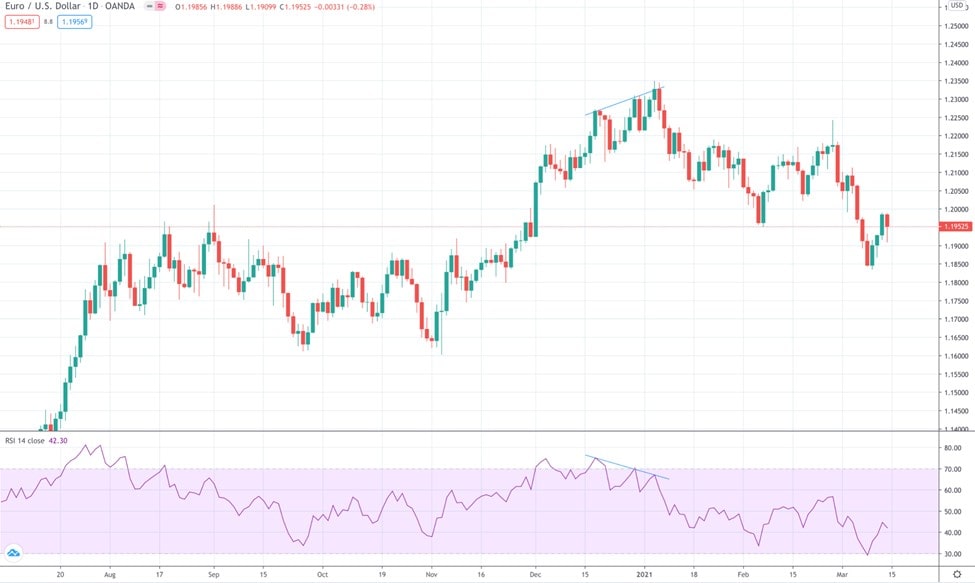
Any of the divergence types can be found when applying the RSI indicator.
Stochastic Oscillator
The Stochastic Oscillator is similar to the RSI indicator and reflects overbought and oversold market conditions. The oscillator consists of two lines that form tops and bottoms, and divergence is based on them. All you need to do is check whether the oscillator formed a high or low that doesn't correlate with the price's high/low.
When using RSI and Stochastic Oscillator, you should be careful as their signals are more frequent, leading to lots of fake alerts. That’s why you should always remember about confirmations.
How to Identify Divergence
The concept of divergence is simple. All you need to do is:
- Apply a technical indicator that is placed below the price chart. We have mentioned the most popular indicators used to identify divergence above.
- Draw the line between the recent highs/lows on the price chart and the indicator. For that, you can use a line tool of the trading platform you use.
- Define whether the price and indicator move in different directions.
- If they do, check whether divergence is based on highs or lows. It will determine the signal.
- Both regular and hidden divergence need confirmation. We never suggest using any market signal solely when other market tools don't confirm the same.
How to Use Divergence in Trading: The Best Strategy
Divergence is one of the easiest concepts you can apply while trading. To increase the number of trades with divergence, learn our trading strategies.
Strategy 1: Take Profit with Divergence
As we mentioned above, divergence doesn't provide clear entry/exit points. You should look for conformations while trading. At the same time, regular divergence predicts the price reversal. Thus, it can still be used to close the trade and take profit.
Divergence doesn't provide clear entry/exit points. Still, you can use divergence as an odd to close the trade and take profit.
Imagine you hold a short position. The price forms bullish divergence with any indicator we mentioned above. Bullish divergence is the first sign of the possible price reversal. However, you always need additional confirmation, no matter if it's a MACD indicator or you use RSI or Stochastic Oscillator.
You can use candlestick patterns, reversal chart patterns, or support levels as confirmation. If patterns forecast a price reversal, the divergence signal is confirmed. If the price has reached a strong support level, it's also a sign of the price reversal. Thus, holding a short position, you should close your trade. The same concept applies to the bearish divergence.
Strategy 2: MACD and Divergence
Let’s consider a real example. On the daily chart of the EUR/USD pair, we see bullish divergence. We will use MACD histogram signals. Before, we said that the MACD indicator could solely confirm the divergence signal. So, as the price and the indicator form bullish divergence, there is a sign the price will rise soon. Moreover, there is a bullish crossover. It means we can open a long position. As we use confirmation from only one indicator, we should care about the stop loss order. Stop Loss should be placed below the price's last low.
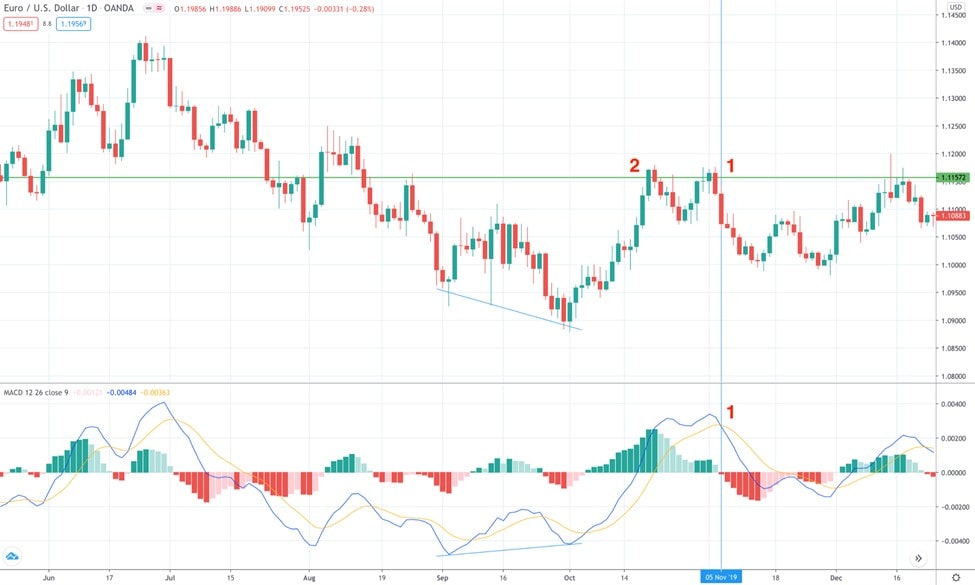
The Take Profit order can be placed at different levels. As we consider the daily chart, we can expect the price to move up for days. We can close the trade as soon as there is a bearish MACD crossover (1). Another option is to place a Take Profit order at the previous resistance level (2).
Key Tips About Divergence
Divergence is an easy tool. That said, it has the features you should always remember to use it correctly:
- Divergence can be found on any timeframe.
- Divergence can be used for any asset.
- Indicators that form divergence with a price chart are usually oscillators.
- Divergence provides both bullish and bearish signals.
- Both regular and hidden bearish divergence is formed with highs. Vice versa, when looking for regular and hidden bullish divergence, consider lows.
- Regular divergence signals a high probability of a market reversal. Hidden divergence is about correction and continuation of the previous movement.
- Divergence is not used to define a perfect entry/exit point. But it can provide the necessary information about the foreseen price direction.
Conclusion: Should You Use Divergence in Trading?
To sum up, divergence is a market condition when the price and indicator move in different directions. The signal of the upcoming market movement forms based on divergence regarding the location of highs and lows. The leading indicators are MACD, RSI, Stochastic Oscillator.
In general, divergence is an easy tool that can be used both by newbies and professional traders. However, hidden divergence can be challenging for you if you have never worked with divergences.
If you lack experience, consider opening a Libertex demo account. You can try live trading without any risk and gain enough experience in a safe environment. Try our divergence strategies on any trading instrument, including CFDs. As soon as you gain the necessary skills, it’ll be tome to open a real account.
Why to trade with Libertex?
- access to a demo account free of charge
- technical assistance to the operator 5 days a week, from 8 a.m. till 8 p.m. (Central European Standard Time)
- leverage of up to 1:600 for professional Ñlients
- operate on a platform for any device: Libertex and Metatrader
FAQ
We have told a lot about the divergence. Now, let's round-up everything we have learned.
What Is Bullish Divergence?
Bullish divergence is a market condition when the price forms lower lows. At the same time, the indicator you chose has higher lows. It's the first signal that the price may rise soon.
What Is Bearish Divergence?
Bearish divergence happens when the price forms higher highs, but the indicators create lower highs. Usually, the price goes down after the formation of bearish divergence.
How Can You Tell Bullish Divergence?
You can locate bullish divergence when you see the price forms lower lows on the chart, while the indicator has higher lows.
What Does Hidden Bullish Divergence Mean?
Hidden bullish divergence is a market situation when the price has higher lows, and the indicator forms lower lows. Such divergence predicts a possible price retracement. It's a great chance to open a long position at lower levels.
How Do You Detect Divergence?
Divergence is one of the easiest technical tools. All you need to do is apply an indicator (the list of the most reliable ones is above) and check whether the price and the indicator move in different directions.
Which Indicator Is Best for Divergence?
We would highlight such indicators as MACD, RSI, and Stochastic Oscillator. Still, you can apply other indicators but be sure you do that in a demo account, not a real one.
What Is Bullish Divergence on MACD?
The MACD indicator forms highs and lows. If the indicator's highs/lows don't match with the price's highs /lows, it's divergence.
How Do You Confirm RSI Divergence?
To confirm the RSI divergence, you need to check whether the price forms different highs/lows than the RSI oscillator. Also, any signal needs confirmation. It’s best to apply support/resistance levels, other technical indicators that predict the market reversal, candlestick, and chart patterns.
What Causes Divergence?
Divergence is caused by the difference in price and indicator directions. It can happen when the indicator predicts the market direction, which is not yet visible on the price chart. One of the reasons for divergence is a change in the market sentiment.
How Do You Trade with Divergence?
To trade divergence signals, you need to remember divergence types. Check whether divergence is caused by highs or lows, and check the table we created for you. The key indicators are RSI, Stochastic Oscillator, and MACD.
How Reliable Is Divergence?
Divergence is a highly reliable tool. Classic divergence is easier and more effective. At the same time, it's also important to know about hidden divergence.
How Do You Spot Bearish Divergence?
During bearish divergence, the price forms higher highs, but the indicators create lower highs. Usually, the price goes down after the formation of bearish divergence.
What Does Divergence Mean in Trading?
Divergence is a market condition when the price and the indicator go in different directions. It helps read the signal of the upcoming price movement.