HFM information and reviews
HFM
96%
FXCC information and reviews
FXCC
92%
FxPro information and reviews
FxPro
89%
FBS information and reviews
FBS
88%
XM information and reviews
XM
86%
Exness information and reviews
Exness
86%

Technical analysis: Beginners Guide


By definition, technical analysis is the forecasting of the future price action of an underlying financial asset based on its past price behaviour. Essentially, technical analysts believe that ‘history repeats itself’ and thus, a price chart is a technical analyst’s best friend.

Forex Market Trends

Technical analysis in CFD and Forex trading refers to the study of historical data and charts, in order for traders to make better-educated trades. It also represents the basis for various automated trading solutions, like the trading bots. Please note, past performance is not always a reliable guide to future performance.

There are 3 basic types of trends:

First, one must decide the type of trader/investor that they are. You must decide whether or not you hold positions for a long time or buy and sell fast. That decision will determine which trading charts you should be using. Day traders or those who jump in and out of positions fast, so they will use daily and intraday charts more than investors who buy and hold for longer period of times.

Practice your Technical Analysis on a Demo Account or open a Real Account if you’re ready to trade.

Support and Resistance Levels

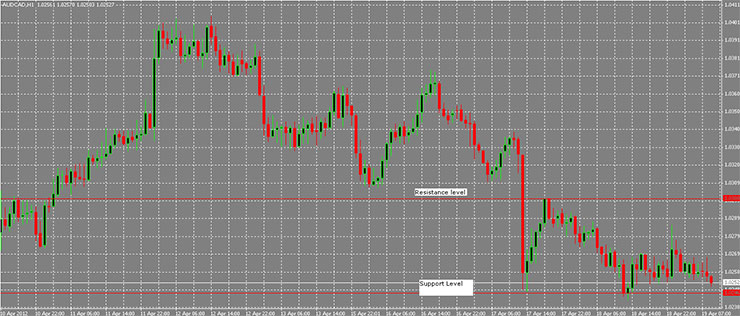
A support level could be the previous low. The resistance level could be the previous day’s high point, or better known as a peak. After a resistance level has been broken, it will usually become a support level should the instrument you are trading decline again. When the instrument moves down and breaks the support, then this becomes the new low. Looking at it the other way, if the instrument moves higher through the resistance level, this becomes the new high.
Retracements

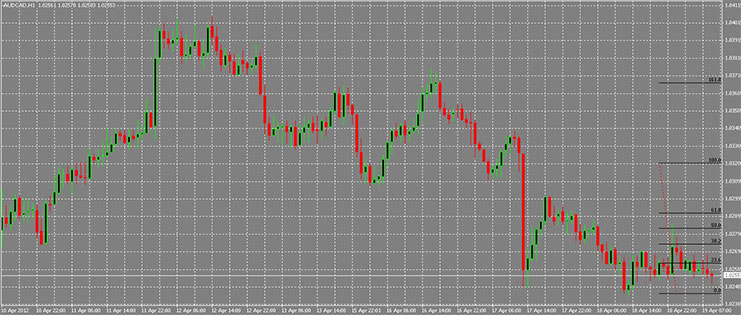
Retracements are percentages. During any given day (open to markets), the instrument you are watching or investing in, will usually retrace previous day’s trades. No matter if they are up or down. The most commonly used is fifty per cent. We also use one third, 38% and 2/3 levels.
Trend Lines

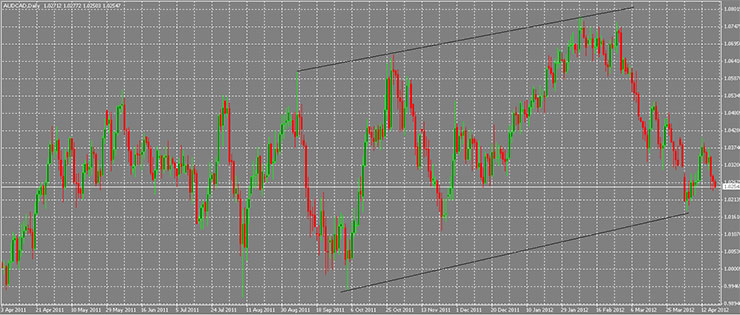
The easiest way to begin your analysis is by learning and applying trend lines. The first thing you must do is to draw a straight line that joins two points on your chart. To show a trend line that is increasing, connect two lows in a row and for a trend line that is decreasing, connect two straight peaks. You will note that usually, the market (price) will pull back towards a trend line before resuming a trend. When the price breaks a trend line, this is the end of a trend. The longer a trend line is, the more it has been tested and the more important it is. Note that a trend line becomes valid when the market touches it 3 times.
Moving Averages

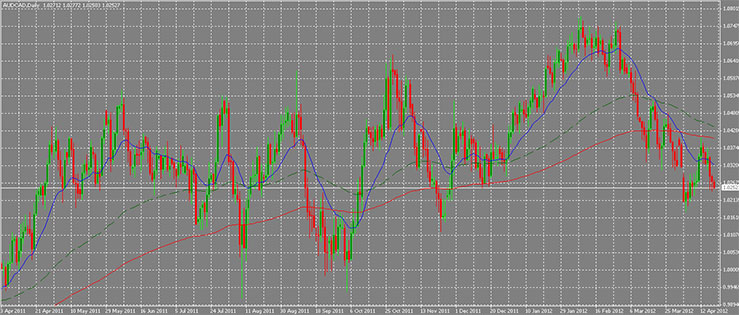
When you are looking for buy and sell signals, you look at moving averages. These averages will tell you if an existing trend is still in play. Beware: these do not predict trend changes, known as reversals. Traders usually use two moving averages. Movements above and below the 20 and 40-day averages are very popular. 5 and 20-day averages are very popular for those who trade quickly.
Oscillators

In order to identify overbought or oversold conditions in markets, oscillators are commonly used. These often warn a trader that a market has either risen or the market has fallen too far and a change is imminent. The Relative Strength Index or RSI and the Stochastics are the most popular oscillators a trader will use. These scales are from 0 to 100. The RSI: if the scale is over 70, this means it is overbought. If the scale is below 30, it is oversold. For Stochastics, the overbought level is 80, and the oversold level is 20.
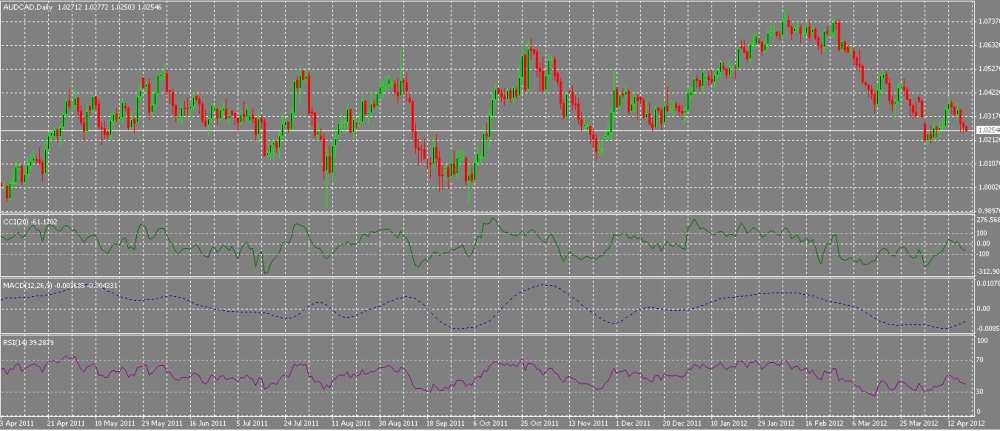
Technical Analysis main FAQs

Does technical analysis really work?

Some people claim that there is no real relationship between the past movement of prices and the future movement of prices, making technical analysis invalid. However, it is easy to see that there are patterns in prices that can be used to predict market movements via technical analysis. There are several theories as to why this is true. One is that chart patterns display the action inherent in an auction market and thus provides predictive value. Another is that orders cluster around psychologically important levels. And some theorize that technical analysis is a form of self-fulfilment in that because many traders believe prices should reverse or continue at certain levels, they do.

What are the most important indicators in technical analysis?

This is going to depend in many ways on your trading style or strategy. A swing trader is likely to use different indicators compared with a scalper. Some analysts claim support and resistance are the most important levels since they are present as part of almost every technical indicator. Support levels and resistance levels become more “important” when they are confirmed by two or more different indicators, and using multiple indicators can provide very powerful trading strategies.

What is divergence in technical trading?

A divergence is when two indicators are not moving in the same direction even though they would usually be expected to do so. While this might create confusion, divergences are often indicators of a significant turning point in the market. For example, an oscillator may indicate weakness in the market even though price continues going higher. Divergence should be traded cautiously however since it can last for a long time and doesn’t typically provide timely signals for trading.

#source


RELATED

Read the markets: Technical & Fundamental analysis

One of the biggest concepts in trading relates to Market Analysis and how to read the markets. This includes both Fundamental analysis and Technical analysis...

Moving averages explained

Learn how to trade with one of the most popular Forex indicators - Moving Averages. In this article, we explain how to use moving averages as a technical analysis...

Do you follow the Trend Lines?

Looking for ways to boost your technical analysis skills? Keep reading to see if trend lines are part of your trading strategy!

CFD Trading Simplified: Strategies for the Modern Online Trader

What if you could trade the global markets with more flexibility than ever before? With CFD trading, you can! Contracts for Difference (CFDs) stand out as powerful instruments within the Forex markets, providing the possibility to capitalize...

FTSE 100 Predictions for 2021 and Beyond

Stock market returns in 2020 were eerily similar to what happened in 2009. We're seeing some strength emerging from a deep stock market recession. Even though...

Beautiful Signals of the Butterfly Pattern

The butterfly pattern. It sounds nice, doesn't it? However, the real hides many difficulties for traders, especially for newbies. It's not a common trading tool...

The role of a technical analyst

Forex traders use technical analysis to forecast future price movements of financial assets based on historical market data. It involves analysing trends, patterns...

What Are Order Blocks In Forex? Unraveling the Impact of Big Market Players

In the vast and intricate world of Forex trading, the presence of order blocks plays a crucial role in shaping market dynamics. Introduced by large financial institutions and central banks...

Three types of Forex analysis

Getting your head wrapped around Forex analysis isn't easy. Especially if you're a novice trader. That is why it is so vital to learn Forex step by step and understand...

Best Forex Trading Patterns: Different Shapes, Common Signals

What do traders use to predict the price direction? Technical indicators, candlesticks, and of course, chart patterns. Overall, there are many trading patterns that occur...

T4Trade: What is Market Analysis in Forex

In this article, we discuss what is market analysis in forex and go into detail regarding fundamental and technical analysis...

What Is a Bear Trap in Trading and How to Handle It?

You may have heard of a bull trap, but if you haven't, we recently covered this topic in an article. In this guide, we'd like to tell you about the opposite event in the market: a bear trap...

A Comprehensive Guide to Technical Analysis: Definition, Tools & Examples

Technical Analysis is a systematized approach employed by traders to predict price movements and trends by examining market data, primarily price and volume...

Leverage and Margin in Forex

Leverage and margin are the terms each trader starts with. The concept is simple, so even a beginner trader will catch on fast. However, there are pitfalls that may affect traders...

XPro Markets - Boost your Technical Analysis Skills

What is your angle when trading in the financial markets? Do you opt for the technical analysis strategy or are you a "fundamentalist" when it comes to trading?

Bullish vs. Bearish Market: How to Distinguish

In trading, you should focus not only on learning new strategies and indicators but also on discovering the terms that are widely used within the trading community. This will help...

How to Calculate the Value of One Point in Forex

A point is a very important concept for calculating possible profit or loss in financial markets. When conducting transactions, you need to clearly understand how much...

Everything To Know About a Crypto Bear Market

When you hear the term "bear market", it typically means that a market has dropped by over 20%. This harkens back to Wall Street, which uses the term bear market to describe when large amounts of losses have been realized...

Strategy session: Why momentum is a short-term traders best weapon

We can approach trading in a very similar vein as many do in Blackjack or how a casino operates, in that we can think in probabilities and potentially forge, and exploit an edge...

Assessing the US 100 Index: Dead Cat Bounce or True Bullish Turnaround?

The US 100 stock index (cash) has garnered significant attention in recent trading sessions. Notably, this past Wednesday, the index showcased an upward momentum...

FP Markets information and reviews
FP Markets
81%
IronFX information and reviews
IronFX
77%
T4Trade information and reviews
T4Trade
76%
Just2Trade information and reviews
Just2Trade
76%
FXNovus information and reviews
FXNovus
75%
Riverquode information and reviews
Riverquode
75%

© 2006-2025 Forex-Ratings.com

The usage of this website constitutes acceptance of the following legal information.
Any contracts of financial instruments offered to conclude bear high risks and may result in the full loss of the deposited funds. Prior to making transactions one should get acquainted with the risks to which they relate. All the information featured on the website (reviews, brokers' news, comments, analysis, quotes, forecasts or other information materials provided by Forex Ratings, as well as information provided by the partners), including graphical information about the forex companies, brokers and dealing desks, is intended solely for informational purposes, is not a means of advertising them, and doesn't imply direct instructions for investing. Forex Ratings shall not be liable for any loss, including unlimited loss of funds, which may arise directly or indirectly from the usage of this information. The editorial staff of the website does not bear any responsibility whatsoever for the content of the comments or reviews made by the site users about the forex companies. The entire responsibility for the contents rests with the commentators. Reprint of the materials is available only with the permission of the editorial staff.
We use cookies to improve your experience and to make your stay with us more comfortable. By using Forex-Ratings.com website you agree to the cookies policy.