


One of the most popular and reliable methods of finding entry and exit signals is identifying candlestick and chart patterns. These patterns are a part of technical analysis, which uses historical market data to analyze how traders of the past behaved under similar market conditions. Since the psychology of traders hasn't changed much over the years, there is a high chance that nowadays traders will act in the same way and confirm the pattern.
In this article, you will learn more about one of the most well-known patterns: a shooting star candlestick pattern. We'll discuss the conditions behind its formation, how to identify it on a chart, and ways you can use it in your trading strategy.
What is a shooting star?
A shooting star is a potent bearish candlestick pattern generally occurring at the end of a prolonged uptrend and before a reversal to a downtrend. This pattern consists of a single candlestick, but what's unique about it is the body: a shooting star candle has a small real body near the day's low. This happens because the price of an asset closes near its opening price, showing that bulls didn't manage to raise the price higher in the span of a day.
At the same time, the upper wick of a shooting star candle is really long, at least twice the length of its body. The lower wick is barely visible, sometimes even non-existent, so the most recognizable part of this pattern is its long upper wick.
What does a shooting star pattern mean?
A shooting star pattern usually occurs after a steady and prolonged uptrend, often after at least three consecutive bullish candles. It can also appear after a few bearish candlesticks, provided that the overall price movement has strong bullish tendencies. The small body and the long wick of a shooting star indicate that bulls who had been dominating the market tried to push the price even higher when the day started. But the higher price swiftly attracted more bears who, in turn, pulled the price back down almost to the opening price.
This pattern shows that bulls might be losing their grasp on the market and signifies a potential shift in market sentiment from bullish to bearish. The buying pressure gives in to the force of the selling pressure, giving traders a sign that the prevailing uptrend may weaken and potentially indicating an impending trend reversal or a significant pullback.
The pattern is considered confirmed if the following candlestick is bearish and closes lower. The upper wick of the successive candle should be shorter than the high of the shooting star. In this case, there is a very high chance that bears have managed to take over the market, so traders may attempt to use this opportunity to place sell orders.
How to trade a shooting star?
In order to make the most out of a shooting star pattern, consider the following steps:
- Identify an uptrend. A shooting star is more reliable when it occurs during a prolonged uptrend. Even though the price never moves in a straight line, each consecutive peak and trough are higher than the previous ones. To identify an uptrend, look for a series of higher highs and higher lows that indicate a clear upward trajectory.
- Look for a shooting star pattern. Scan the chart for a candlestick with a small body near the day's low, a long upper wick at least twice the length of the body, and a short lower wick.
- Validate with additional indicators. To get a fuller picture on the possibilities of a reversal, make use of technical analysis indicators. With them, you can measure other parameters of the current price action, such as the direction of a trend, trading volume, price momentum, support/resistance levels, etc. If other indicators give strong reversal signals, you have more reasons to believe that the shooting star pattern will lead to a change in the direction of price movement.
- Plan your trade. Spotting any chart pattern gives you a unique opportunity to plan your entries and exits. Once a shooting star is confirmed, you may establish an entry point at the level a confirmation has occurred, set a stop-loss order above the upper wick to manage risk, and determine a profit target based on your trading strategy and risk-reward ratio.
Shooting star: example
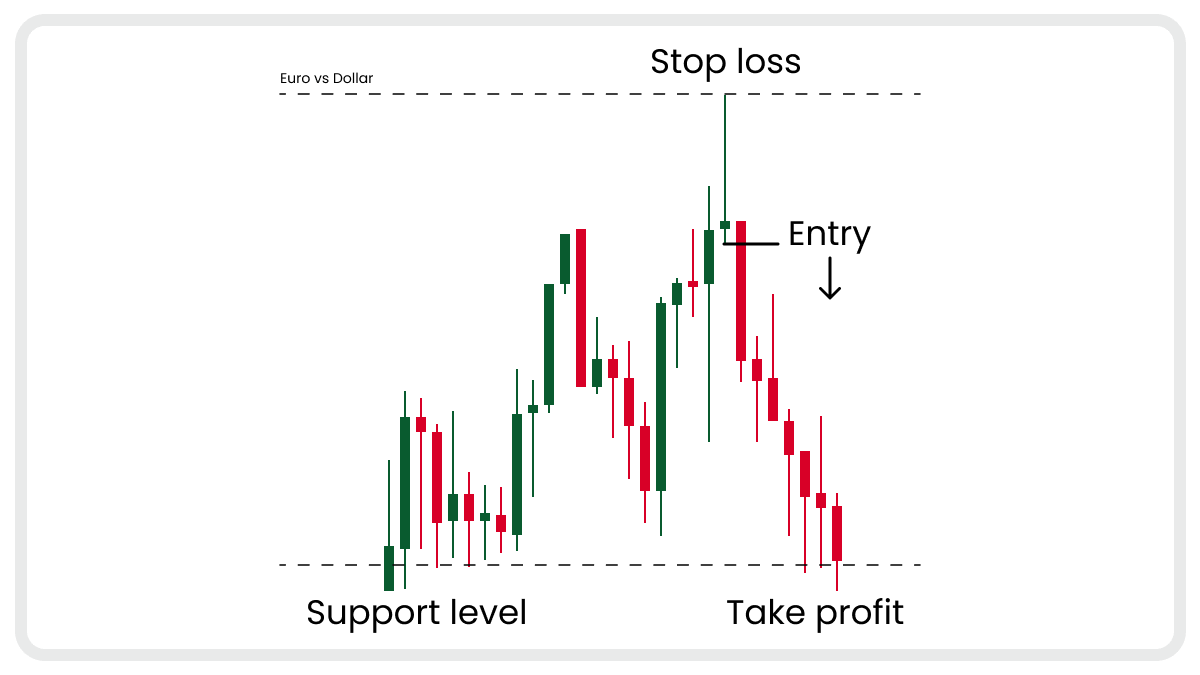
This chart shows that a shooting star with its short body and long upper wick appeared at the top of the third peak. It is closely followed by a bearish candlestick that closed much lower than the shooting star, indicating that the bears managed to overpower the bulls and reverse the trend completely. The entry point is placed below the lower wick of the shooting star, while the Stop Loss is set above its upper wick. The take-profit order is placed at the previous support level in case the price bounces again.
Advantages and limitations of a shooting star pattern
Both retail and professional traders hold a shooting star pattern in high regard. Let's look at the most notable advantages of this pattern:
- Easy to identify. Shooting stars include only one candlestick with a very distinct form, making it easier to spot on the chart than most other patterns.
- Reliability. Traders note that shooting star patterns are particularly useful and reliable when identifying potential trend reversals, especially if it occurs near the resistance level and all other necessary conditions are met.
- Suitable for beginners. This pattern is fairly simple, so even beginners can spot and trade it.
- Frequency. This pattern is one of the most frequent patterns appearing on the chart, so traders have many opportunities to find and use it to their advantage.
However, even shooting stars have certain limitations that traders need to take into account if they want to avoid common pitfalls. Here are the most common of them:
- False signals. False signals can really spoil a potentially profitable trade. As with any trading pattern, a shooting star candlestick pattern can give off false signals, especially in volatile or choppy markets. Therefore, it is crucial to wait for the confirmation of the pattern or employ additional confirmation techniques to validate the pattern's reliability before placing trade orders.
- Confirmation through indicators. While a shooting star is considered a reliable pattern, it's still important to use other means of analysis, like technical analysis indicators mentioned above, to ensure the reversal signal isn't false.
- Contextual analysis. The price of assets doesn't move in a vacuum. Multiple factors affect it, so analyzing the current market conditions and context will help you get more information and prevent you from trading against the prevailing trend.
Shooting star and inverted hammer: what is the difference?
A shooting star pattern is often confused with an inverted hammer pattern. It's unsurprising, considering that both are single-candlestick reversal patterns with a small body, longer upper wick, and extremely short or non-existent lower wick. Just like a shooting star, an inverted hammer indicates that the price has been pushed up by bulls but closed near the opening price because of selling pressure.
However, unlike a shooting star, an inverted hammer occurs at the end of a downtrend. In contrast to the bearish nature of a shooting star, an inverted hammer indicates that bulls are finally getting stronger, and the trend might reverse to a bullish one.
So to tell a shooting star and an inverted hammer apart, you need to identify the current trend. If it's bullish, the candlestick in question is a shooting star. But if it's bearish, you're looking at an inverted hammer.
Conclusion
As you learned today, a shooting star pattern is an extremely valuable tool, offering valuable insights into market sentiment and potential price reversals. By applying the knowledge gained from understanding this pattern, traders can increase their chances of success in the ever-changing world of trading.
However, it is important to remember that no strategy is infallible, and continuous learning, adaptation, and integration of multiple analysis techniques are essential to thrive in the dynamic financial markets.


