HFM information and reviews
HFM
96%
FXCC information and reviews
FXCC
92%
FxPro information and reviews
FxPro
89%
FBS information and reviews
FBS
88%
Vantage information and reviews
Vantage
85%
MultiBank Group information and reviews
MultiBank Group
84%

A matrix to understand the Gold market


US investment bank Morgan Stanley produced a research note yesterday detailing that they see a period where "real" US bond yields rise in the near-term. They're not alone in that call. Like any call, one should not blindly follow it in, but for me the logic and reasoning is always fascinating and is most important.

I don’t trade TIPS (Treasury Inflation Protected Securities) specifically, which would be a direct way to trade the call, but over the past decade we've seen US Treasuries adjusted for expected inflation or ‘real’ yields, being the independent variable, driving the USD, Gold and Tech. It made me consider the USD and more so Gold.

You can find more on US bond markets on the St Louis Fed website, although it's delayed.

Orange – Gold (inverted). Blue – US 10yr real yield

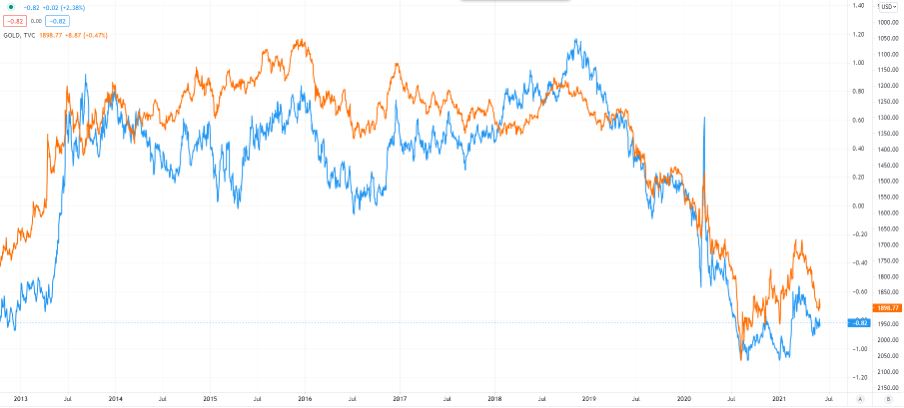
To visualise the dynamics, I've put together a playbook which focuses on the core driver of the Gold market – US Treasuries, real and nominal. The VIX index you can see on the MT4/5 or cTrader platforms is effectively the implied volatility in the S&P 500 over the coming 30 days – a proxy of equity volatility.

Here’s how I see the plays and breakevens equal inflation expectations over the coming 5 or 10 years.

Bullish backdrop for gold (in order of impact)

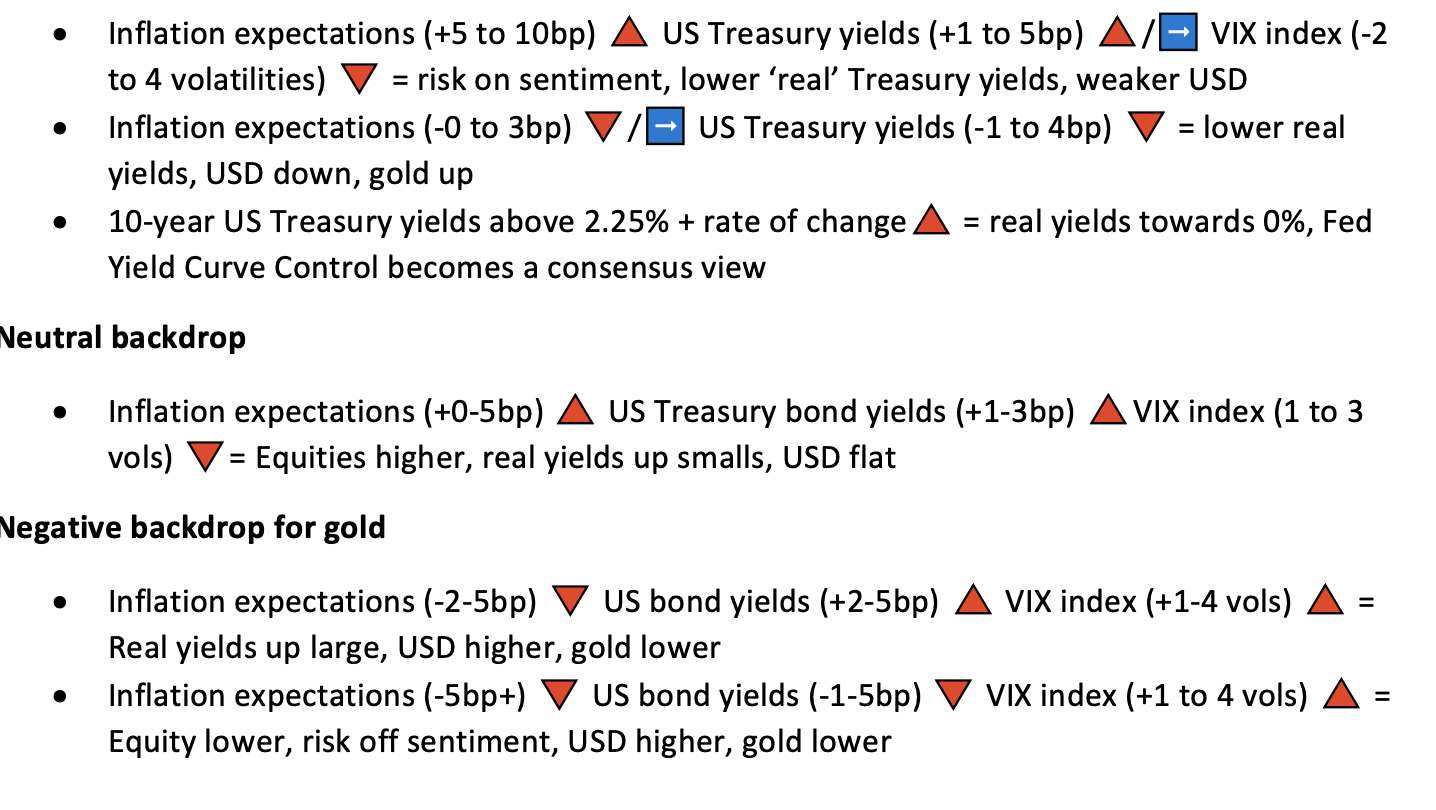
This may be confusing to some, which is why price action is always the best place to start in this business. For macro heads, this matrix could be helpful and if indeed we're moving into a higher real rates environment, the prospect is of a stronger USD, then a weaker Gold price could play out.


RELATED

ADX: Find the Strong Trend

In a wide variety of indicators that provide different signals, it's almost impossible to find the one that defines the trend's strength. It's vital to know whether the trend is stable or not, especially during...

Ascending Triangle Pattern in Trading

Investors tend to use different tools to define market direction - technical indicators, candlestick, and chart patterns are all key to successful trading. There is a wide...

The US Dollar Index Chart. What is it, and how do you use it?

Many traders use indices in their trading. The stock market offers a huge variety of indices such as the S&P 500, NASDAQ, Dow Jones, etc. They provide a picture...

CFD Trading Simplified: Strategies for the Modern Online Trader

What if you could trade the global markets with more flexibility than ever before? With CFD trading, you can! Contracts for Difference (CFDs) stand out as powerful instruments within the Forex markets, providing the possibility to capitalize...

Moving averages explained

Learn how to trade with one of the most popular Forex indicators - Moving Averages. In this article, we explain how to use moving averages as a technical analysis...

Hammer Candlestick Pattern: Build Your Reliable Signal

There is a wide range of technical indicators, chart and candlestick patterns that provide signals for newbie and experienced traders. Today we will focus on...

A Comprehensive Guide to Technical Analysis: Definition, Tools & Examples

Technical Analysis is a systematized approach employed by traders to predict price movements and trends by examining market data, primarily price and volume...

Introduction to technical analysis in forex trading

Learn how traders use technical analysis to enhance their strategies and make informed trading decisions...

What Is the Risk/Reward Ratio and How to Use It

The risk/reward ratio tells you how much risk you are taking for how much potential reward. Good traders and investors choose their bets very carefully. They look for the highest potential upside...

Technical Analysis: Directional Movement Index

Get ready for another instalment in our technical analysis educational series. After a multi-week hiatus, we’re back and ready to share even more knowledge

What is technical analysis?

Technical analysis in one of the most widely used methods of forecasting price movements. The basis behind this type of analysis is the supposition that on the market...

Assessing the US 100 Index: Dead Cat Bounce or True Bullish Turnaround?

The US 100 stock index (cash) has garnered significant attention in recent trading sessions. Notably, this past Wednesday, the index showcased an upward momentum...

Key Economic Indicators And How To Use Them In Forex Trading

Financial markets as well as the economy of any country in general are not static. It experiences periods of growth and decline, which together make up economic cycles...

Bullish vs. Bearish Market: How to Distinguish

In trading, you should focus not only on learning new strategies and indicators but also on discovering the terms that are widely used within the trading community. This will help...

The Ascending Triangle Pattern in Trading

Investors tend to use different tools to define the market direction. Technical indicators, candlesticks and chart patterns are all key to successful trading...

The Ultimate Guide to the Best Forex Candlestick Patterns

Trading Forex is a complex game that absorbs a lot of time and requires psychological endurance and vast knowledge of all aspects of the art of price prediction...

Depth Of The Market: Definition And Meaning

Depth of the Market is a special technical indicator developed for the MetaTrader 4 terminal. It is designed to monitor the current price movement and also to determine the supply and demand zones...

How to Trade Shooting Star Pattern

One of the most popular and reliable methods of finding entry and exit signals is identifying candlestick and chart patterns. These patterns are a part of technical analysis...

Best Trading Indicators: A Guide to the 17 Most Popular Technical Analysis Tools

In the intricate world of financial trading, one can easily get overwhelmed by the enormous amounts of data flooding the markets daily. Technical analysis offers a structured approach...

Currency Strength Meter: Complete Guide

Any trader needs to define the direction of the currency pair. It is also important to remember that the market movement is defined by the strength and weakness...

XM information and reviews
XM
82%
FP Markets information and reviews
FP Markets
81%
FXTM information and reviews
FXTM
80%
AMarkets information and reviews
AMarkets
79%
Octa information and reviews
Octa
79%
BlackBull information and reviews
BlackBull
78%

© 2006-2025 Forex-Ratings.com

The usage of this website constitutes acceptance of the following legal information.
Any contracts of financial instruments offered to conclude bear high risks and may result in the full loss of the deposited funds. Prior to making transactions one should get acquainted with the risks to which they relate. All the information featured on the website (reviews, brokers' news, comments, analysis, quotes, forecasts or other information materials provided by Forex Ratings, as well as information provided by the partners), including graphical information about the forex companies, brokers and dealing desks, is intended solely for informational purposes, is not a means of advertising them, and doesn't imply direct instructions for investing. Forex Ratings shall not be liable for any loss, including unlimited loss of funds, which may arise directly or indirectly from the usage of this information. The editorial staff of the website does not bear any responsibility whatsoever for the content of the comments or reviews made by the site users about the forex companies. The entire responsibility for the contents rests with the commentators. Reprint of the materials is available only with the permission of the editorial staff.
We use cookies to improve your experience and to make your stay with us more comfortable. By using Forex-Ratings.com website you agree to the cookies policy.