HFM information and reviews
HFM
96%
FXCC information and reviews
FXCC
92%
FxPro information and reviews
FxPro
89%
FBS information and reviews
FBS
88%
XM information and reviews
XM
86%
Exness information and reviews
Exness
86%

Choosing a Trading Instrument: How to Trade Indices


Stock indices indicate changes in the value of certain groups of stocks. An index reflects the dynamics and the current state of the stock market as a whole. For example, FTSE 100 shows changes in the stock price of the 100 companies with the largest market capitalization traded on the London Stock Exchange, while S&P 500 deals with the 500 largest US companies.

What does Dow Jones indicate?

Indices have occupied an important place in the financial markets for a long time. The first index was created by Charles Dow back in 1896 and was named the Dow Jones Industrial Average. It tracks the development of the industrial component on the American stock markets. Initially, it included the 12 most influential American companies, today their list has expanded to 30.

Since it’s impossible to track the stock price of every company in a country, all stock exchanges have their own reference stock index or several indices to help traders and investors determine the overall performance of a particular market. Stock indices are indispensable for analyzing the performance of financial markets and individual companies in these markets.

How are stock indices calculated?

At the time of the first index, calculations weren't easy. Nowadays, there is a universal formula used by most stock exchanges: a weighted average formula for determining the value of an index.

The formula looks like this: Stock weight = Stock price x Number of stocks / Market capitalization of all stocks

Benefits of trading indices

Index trading is very popular with traders due to the highest profitability. Let’s turn to specific numbers for illustrative purposes.

These numbers refer to index contracts only, excluding margin rates when using CFDs. The best trust funds show a yield of 10–15% per annum. Minus the fund’s commission. The numbers speak for themselves.

Index trading strategies

The most important trading strategy in the index market: not to try to keep up with every trend. Determining the right amount of deposited funds to use for trading with this instrument is the key to success.

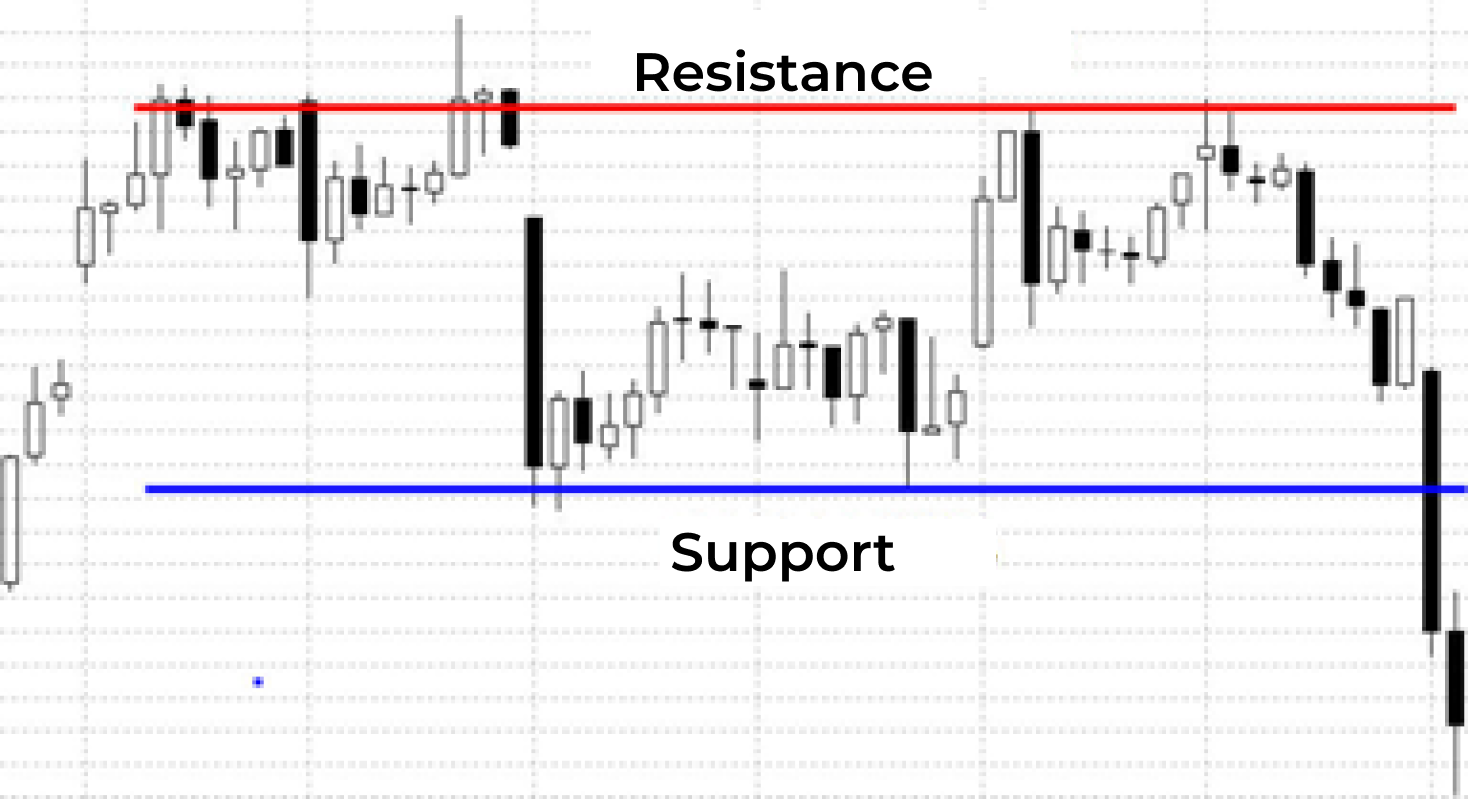
Let’s look, for example, at the one of the classical trading strategies for indices:

In this case, when the chart crosses the lower level, a buy order is opened, if the upper one, then a sell order. It is better to place trades on the market without using pending orders, to avoid triggering false signals. We advise you not to open orders less than an hour before the close of the trading session, as well as if the day opens with a strong swing.

In the arsenal of Grand Capital there are CFDs on 12 indices, among which you can find major American, European, and Asian indices.

In previous articles on choosing a trading instrument, we have already talked about the peculiarities of trading currency pairs, cryptocurrency and CFDs on stocks. In the following articles in this series, we’ll talk about other popular instruments so that you can make your own decision and choose the suitable assets for your trading.

#source


RELATED

Support and resistance indicators: how to trade S&R in Forex

Support and resistance levels are one of the most important concepts in Forex trading. Many technical tools rely on support and resistance lines to find or to confirm trade setups...

Hammer Candlestick Pattern: Build Your Reliable Signal

There is a wide range of technical indicators, chart and candlestick patterns that provide signals for newbie and experienced traders. Today we will focus on...

A Comprehensive Guide to Technical Analysis: Definition, Tools & Examples

Technical Analysis is a systematized approach employed by traders to predict price movements and trends by examining market data, primarily price and volume...

Currency Strength Meter: Complete Guide

Any trader needs to define the direction of the currency pair. It is also important to remember that the market movement is defined by the strength and weakness...

The Ascending Triangle Pattern in Trading

Investors tend to use different tools to define the market direction. Technical indicators, candlesticks and chart patterns are all key to successful trading...

Unlocking the Power of Technical Analysis in Trading

Technical analysis, often regarded as a cryptic endeavor for newcomers to the world of capital markets, is an essential tool for traders and investors seeking insights...

Price Gaps In Forex Trading: Types, Causes, And Strategies

Price gaps are a common phenomenon in forex trading, characterized by a significant difference between the closing and opening prices of an asset...

A Pullback: Trade Against a Trend

Reading analytical outlooks on the price movements, you might be met with the word “pullback”. Many trading strategies are based on a pullback action...

Technical Analysis Tools

Read on to find out about some of the most popular technical analysis tools that traders can use, such as Bollinger Bands, MACD, and RSI...

XPro Markets - Boost your Technical Analysis Skills

What is your angle when trading in the financial markets? Do you opt for the technical analysis strategy or are you a "fundamentalist" when it comes to trading?

What Is MACD Indicator and How It Works?

The Moving Average Convergence Divergence (MACD) is a technical indicator that measures a relationship between two exponential moving averages...

What Is a Bear Trap in Trading and How to Handle It?

You may have heard of a bull trap, but if you haven't, we recently covered this topic in an article. In this guide, we'd like to tell you about the opposite event in the market: a bear trap...

Stop Orders Demystified: A Comprehensive Examination

In the intricate tapestry of financial markets, an arsenal of tools and techniques awaits traders and investors. Among these, trading orders serve as the backbone of any robust trading strategy...

Which indicator is best for forex trading

Success is what everybody wants when first enter the forex market. Just for success they do learn how to trade themselves, hire brokers and cooperate with each other...

Fundamental and Technical Analysis

When it comes to analysing the financial markets there are two primary approaches used. One is technical analysis and the other is fundamental analysis, and they are quite...

Technical analysis: Beginners Guide

By definition, technical analysis is the forecasting of the future price action of an underlying financial asset based on its past price behaviour. Essentially, technical...

Bullish and Bearish Divergence: How to Catch a Signal

In analytics, there is a chance you’ll come across the term divergence. Divergence is one of the well-known market conditions that provide reliable signals...

The Double Top Pattern: An In-Depth Guide to Mastering a Timeless Reversal Signal

While it's often claimed that markets are unpredictable, there's a method to the madness. Certain price chart patterns like the double top pattern offer a systematic way to read market movements, acting as historical footprints that signal future trends...

A matrix to understand the Gold market

US investment bank Morgan Stanley produced a research note yesterday detailing that they see a period where real US bond yields rise in the near-term...

Bull Flag Pattern in Trading - Open Long Trades

In the world of technical indicators and patterns, finding a reliable, workable tool that would help you predict price direction is challenging. However, they exist...

FP Markets information and reviews
FP Markets
81%
IronFX information and reviews
IronFX
77%
T4Trade information and reviews
T4Trade
76%
Just2Trade information and reviews
Just2Trade
76%
FXNovus information and reviews
FXNovus
75%
Riverquode information and reviews
Riverquode
75%

© 2006-2025 Forex-Ratings.com

The usage of this website constitutes acceptance of the following legal information.
Any contracts of financial instruments offered to conclude bear high risks and may result in the full loss of the deposited funds. Prior to making transactions one should get acquainted with the risks to which they relate. All the information featured on the website (reviews, brokers' news, comments, analysis, quotes, forecasts or other information materials provided by Forex Ratings, as well as information provided by the partners), including graphical information about the forex companies, brokers and dealing desks, is intended solely for informational purposes, is not a means of advertising them, and doesn't imply direct instructions for investing. Forex Ratings shall not be liable for any loss, including unlimited loss of funds, which may arise directly or indirectly from the usage of this information. The editorial staff of the website does not bear any responsibility whatsoever for the content of the comments or reviews made by the site users about the forex companies. The entire responsibility for the contents rests with the commentators. Reprint of the materials is available only with the permission of the editorial staff.
We use cookies to improve your experience and to make your stay with us more comfortable. By using Forex-Ratings.com website you agree to the cookies policy.