


Blockchain transaction data is publicly available, creating possibilities for data science and machine learning. All trading and investment activity can be extracted from the public ledger and analyzed, which is what is known as “On-Chain Analysis.” Using this data can give the trader hints about the market’s direction. On-chain analytics is a field of study examining the fundamentals, utility, and transaction activity of cryptocurrency and blockchain data. Analysts try to improve their understanding of network movements by analyzing various metrics.
Some of the most common types of analysis include transaction volumes, block details, price correlation, exchange inflows and outflows, user adoption, and more.
History of On-Chain Analysis
The first form of on-chain analysis is known as “coin days destroyed.” It was created by ByteCoin in 2011 as a way to measure market health and participation by looking at the age of bitcoins transferred on a given day. Another Bitcoin metric was added three years later, known as a “Network Value.” It utilizes principles from Metcalfe’s Law, focusing on unique address growth. In the same year, John Racliff posted an early version of what would become known as HODL waves. Willy Woo, one of the most widely followed on-chain analysts, created Network Value to Transactions Ratio, also known as NVT, in 2017, when the explosion of on-chain analysis truly took off. Glassnode, Coin Metrics, and several other major players in the industry started to develop their own metrics as well.
It’s worth noting that since these developments in 2018, there has been a massive increase in the quantitative use of on-chain analysis. This has brought into the picture multiple new data providers and analysts and continues to spur the development of new analytic processes.
How does on-chain analysis work?
Metrics for on-chain analysis are wide and varied, but can generally be categorized into three main types. These include crypto market capitalization, HODL status, and the future prospects of the cryptocurrency in question.
- Total Market Capitalization. The market capitalization of a cryptocurrency is the net value of the blockchain network. The total value of the network is defined as the total you get when multiplying the crypto’s price by its total circulating supply. Analysts and traders can also use market capitalization to evaluate the market size, adoption, and other fundamental factors of the crypto asset.
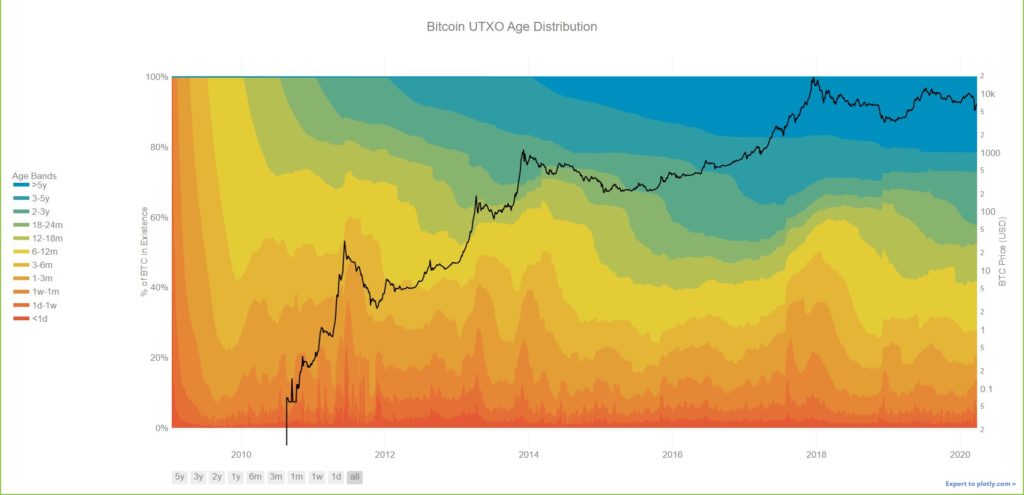
- Hold Status (HODL Wave). There is a metric called “HODL Wave” that determines the trend in the market and the age of cryptocurrency held by users. This allows analysts to determine whether traders are holding the asset for an extended period of time or if they are selling it quickly. It provides insight into the attitude of traders and the potential direction of longer-term moves.
- The Future Prospects of a Cryptocurrency. Understanding where a crypto asset is going next can often be a function of whether the asset is gaining or losing traction among investors. The futures contract open interest can be analyzed, just as other factors like the correlation between the token and the price of Bitcoin. Total exchange inflows and outflows also can fall in this category as well.
How to Use On-chain Analysis for Crypto?
As cryptocurrency and blockchain data are transparent and easily obtained, they can provide opportunities for on-chain analysts to research a network and understand the cryptocurrency market based upon fundamental data.
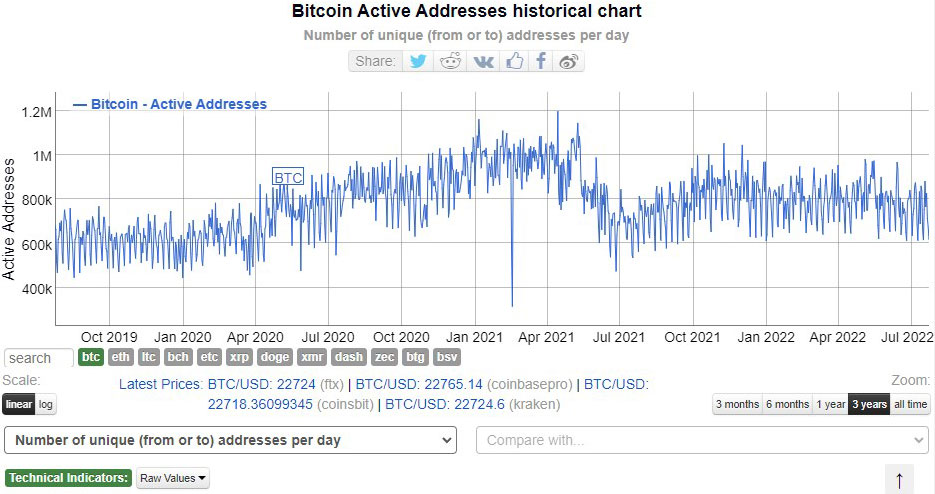
- Predict Future Market Movements. By monitoring investor behavior and network health in real-time, on-chain analysts can enhance trading strategies and predict future market movements. One typical example is taking into account the number of active addresses in the number of transactions on a network to determine whether demand and interest in that crypto will rise or fall.
- Study Investor Behaviors. On-chain metrics can provide details of investor behavior. Analysts will often examine the time an address has held onto a currency. If the number of investors HODLing the crypto increases, the circulating supply is lower. It also suggests that demand could pick up. Beyond that, it shows plenty of confidence in the future.
How Is On-Chain Different from Off-Chain?
Transactions can be identified as “On-chain” or “Off-chain.” Off-chain transactions are not fully executed or even partially performed and recorded on the blockchain. This is the opposite of on-chain transactions, where the transfer of value or data occurs on a blockchain network and therefore gets recorded for all to see.
Some transactions are considered “off-chain”, such as the exchange of private keys from one party to another, allowing full access to the owner’s funds. This is one way that some people bypass high transaction costs for exchanging crypto, such as Bitcoin.
One-chain transactions are recorded to the blockchain and are the most common transactions involving cryptocurrency. There is a slowdown in the transaction speed as opposed to handing someone the private keys or even a cold storage wallet. An on-chain transaction is infinitely safer. You can sometimes notice anomalies that suggest there is more off-chain movement.
What are the Advantages of On-Chain Analysis?
While the idea of on-chain analytics is relatively new, it gives you the ability to make more informed investment decisions regarding cryptocurrency. Some of the main advantages include:
- Investor behavior: One of the greatest things that on-chain analytics can tell us is how the trading community feels about a particular currency. For example, if they hang onto it for a significant amount of time, it shows true belief.
- Network adoption: By keeping an eye on the number of network addresses, you can draw a logical conclusion as to whether or not the network is attracting new users and growing.
- Transactions: Perhaps the most important thing to pay attention to is whether or not people were using the network. If transactions are dropping, that may show a lack of interest. On the other hand, if transactions are spiking rather quickly, then it could show exponential growth.
What are the Disadvantages of On-Chain Analysis?
While the advantages of on-chain analysis are numerous, it is not a perfect science. Keep a few things in the back of your mind while looking through it.
- Can be “Bulky”: On-chain analysis can be challenging. Some of the more popular websites that feature information can have as many as 100 metrics.
- Can be late: On-chain analysts are often looking at backward-looking metrics. While it is relatively fresh most of the time, the reality is that it doesn’t take into account where we’re going, just where we are coming from. There is a certain amount of predictive quality, but it is not the be-all and end-all of analysis.
What are the On-chain Analysis Metrics?
To use on-chain analytics for your trading is essential to have up-to-date information. There are several services, such as Glassnode, Messari, and Coinmetrics, where you can get the following information. Incorporating this information into your trading can give you an advantage.
Using On-chain Analysis to Measure the Network Strength
The following metrics are some of the most important that you can use to assess a crypto project’s health, viability, and perhaps potential direction. The main idea is to determine how a network and its health are performing.
- Active addresses. The number of active addresses can show activity on a network. While it doesn’t necessarily show the number of users, it shows the number of addresses used by exchanges, miners, and individuals. Over the longer-term, active addresses tend to correlate with price.
- Transaction volume. Transaction volume represents the amount of cryptocurrency exchanged between addresses on a network. It’s typically measured in fiat currency, ironically enough.
- Daily issuance. The daily issuance of crypto is the total amount of new coins miners and stakers are awarded daily. This is important to keep an eye on because it will tell you whether or not a cryptocurrency’s monetary policy is functioning correctly.
- Supply distribution. Supply distribution will show the percentage of coins held in addresses categorized by size. In the Bitcoin network, addresses containing more than 10,000 coins have decreased over the past few years, while addresses holding less than 10 have increased.
- Miner revenue. Miner revenue is the sum of newly mined coins plus transaction fees. Higher revenues reflect a healthy network, where the miners and stakers are incentivized to protect the longer-term interest and health of the network.
- Hash rate. The hash rate is a measurement of the processing power that miners generate to secure a network. As a general rule, the higher the hash rate, the more secure the network is.
Using On-chain Analysis to See Who’s Buying and Selling
The on-chain indicators mentioned previously represent the longer-term health of the network, but the following indicators will be more representative of short to mid-term market action. They can show such things as how much is being held by exchanges, miners, and individuals. It also can show whether or not they are in profit or are currently at a loss. This can be a telling indicator of what market sentiment may be like.
One of the most common forms of analysis is paying attention to the number of coins moved on to exchanges. If longer-term investors have made significant money over the last six months and are starting to move coins onto exchanges, it could indicate they are preparing to sell their holdings, causing a bit of a correction.
- Cointime destroyed. Cointime destroyed is a calculation sorted by taking the number of coins transacted in a day and multiplying them by the time they were previously held. This gives us a rough idea of the turnover time of a cryptocurrency. An increase in this metric implies that holders are moving coins out of their wallets and taking profits.
- Realized profits and losses. This metric measures the value of Bitcoins sold at either a profit or loss. For example, a coin purchased at $20,000 and sold at $33,000 is counted as a $13,000 profit.
- Supply in profit or loss. The supply of coins in profit or loss shows the numbers of coins currently worth more than they were bought for or worth less. In a growing market, more coins will be in profit than loss.
- Realized capitalization. Realized capitalization adds the most recent purchase price of every coin in supply together. By comparing this to market capitalization, which is the number of coins multiplied by the current price, you can understand whether the overall market is sitting in profit.
- Thermo capitalization. Thermo capitalization is the value of a cryptocurrency paid to miners for validating the network. Typically measured in fiat currency such as the US dollar, you can have a grasp on supply pressures either rising or declining.
- HODL waves. HODL waves illustrate the percentage of coins held for different periods, ranging from less than one month to more than seven years. As the longer-term ranges continue to grow, that’s a sign that there are a lot of true believers in the network.
- Using On-chain Metrics to Evaluate a Cryptocurrency’s Price. If you are trading a cryptocurrency frequently, you need to know what’s currently happening in the market. Sometimes, it’s worth being aggressive; other times, it will be worth your time being cautious. The following ratios can give you an idea of short-term trends.
- Market Value to Realized Value (“MVRV”). Market Value to Realize Value, also referred to as “MVRV”, is a ratio that represents the difference between market capitalization and realized capitalization. Generally, a high MVRV has historically meant that the price was near a local top, while a low ratio will sometimes indicate that we are near a local bottom.
- Network Value to Transaction (NVT). The Network Value to Transaction ratio is a metric used to compare the market cap to the network’s transaction volume. It’s similar to the Price to Earnings ratio in traditional stock markets. It aims to compare the fundamental value of the network to the current price. A low value represents bearish sentiment, while a high value can signal bullish sentiment.
- Stock-to-flow ratio. The stock-to-flow ratio is a model that can give price predictions for cryptocurrency, with Bitcoin being the most common example. It suggests what enterprise could be based upon current demand over the long run.
- Stablecoin Supply Ratio. The Stablecoin Supply Ratio is the ratio between the supply of a coin and the stablecoin supply. It can suggest the short-term buying power of the coin itself.
Conclusion
On-chain analytics can be helpful for both short-term and long-term traders. It is the closest thing to traditional fundamental analysis that the trader has in the crypto markets because, quite frankly, we have no idea where these markets end up in the future. They are still very new, and the final use case scenario is more likely than not going to be something people are not even thinking of right now.
Understanding whether or not addresses and transactions are rising, or falling can give you an idea as to whether or not there is interest in the network, as it shows not only usage but potentially new users as well. You can also look at other things, such as whether or not miners are flooding the market with supply or if supply is starting to dwindle.
By understanding the underlying health of a network, you can get an idea as to whether there are many possibilities when it comes to growth, value, and, most notably, for investors: price appreciation. Even if you are not holding the actual crypto and trading CFDs at PrimeXBT, you can use this type of analysis to build on top of a trading system to further your success.
FAQ: Frequently Asked Questions
- What is a chain in crypto? A chain is the same thing as a blockchain, a public ledger that the strength of all data and value transfers in a network.
- What is off-chain crypto? Generally, when people use the phrase “off-chain crypto,” they talk about transactions by people handing over private keys. On the other hand, it can also denote crypto sitting in a wallet somewhere.
- What are on-chain and off-chain crypto? On-chain is anything on the distributed ledger and shown on the blockchain. By contrast, off-chain is when crypto is either held in a wallet and not on the blockchain, perhaps transferred by handing over the cold wallet or private keys.


