The USDCAD on the D1 time frame was in an uptrend until 16 December when a last higher top was registered at 1.37050. A closer look at the Momentum Oscillator reveals negative divergence between point “a” and “b” when comparing the tops at 1.36999 and 1.37050. This could have warned technical traders that the conviction among bullish traders is waning.
After the higher top at 1.37050, the price raced through the 15 and 34 Simple Moving Averages and the Momentum Oscillator changed direction into bearish territory. This further confirmed that the bears were on the move.
A possible critical support level formed when a lower bottom was recorded on 27 December at 1.34843. The bulls fought back but a lower top took form on 3 January at 1.36851 as the bears took back control of the market again.
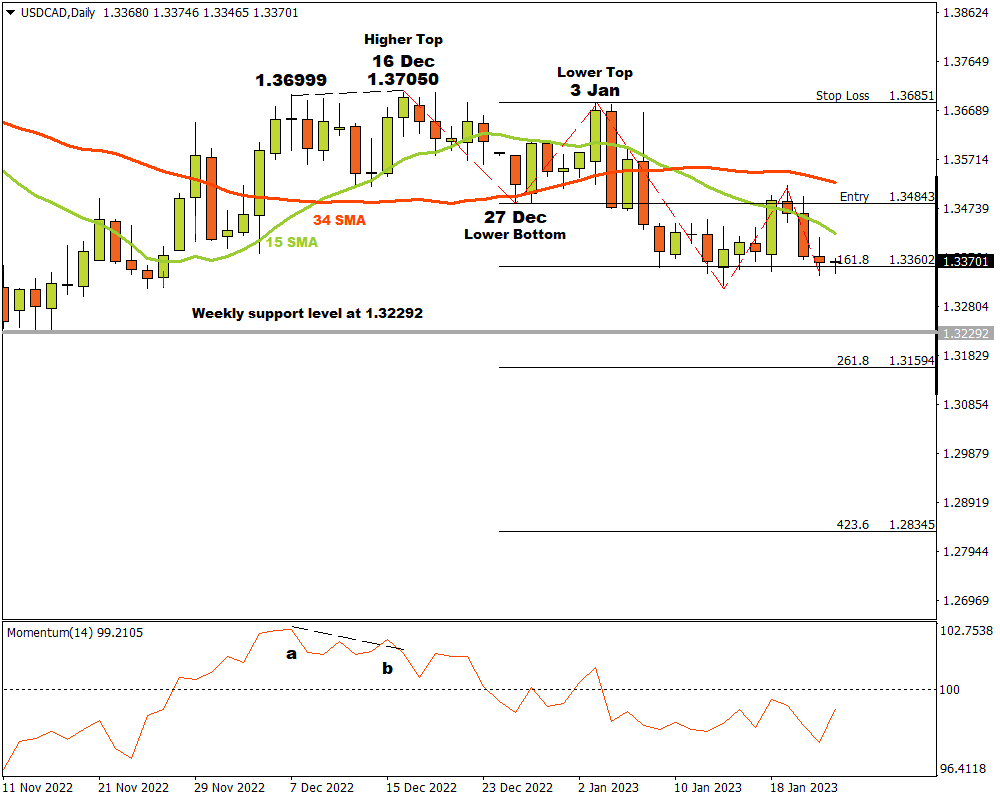
On 4 January the price of the USDCAD broke through the critical support level at 1.34843 and three possible price targets were projected from there. Attaching the Fibonacci tool to the lower bottom at 1.34843 and dragging it to the resistance level at 1.36851, the following targets were calculated. The first target was estimated at 1.33602 (161.8%) and the market triggered this on 9 January. The second price target was calculated at 1.31594 (261.8%) and the price will have to break through a strong weekly support level at 1.32292 to reach this target. The third and final target can be expected at 1.28345 (423.6%).
If the resistance level at 1.36851 is broken, the above scenario becomes invalid, and any open risk must be reduced or removed. As long as sellers maintain the negative sentiment and supply overcomes demand, the outlook for the USDCAD currency pair will remain bearish.
For more information, please visit: FXTM