The Aussie on the D1 time frame was in an uptrend that lasted until 13 January when a last higher top was recorded at 0.73142. A closer look at the Momentum Oscillator revealed a negative divergence between point ‘a’ and ‘b’ when comparing the higher tops at 0.72778 and 0.73142. This should have alerted technical traders that a possible change in momentum was on the way. After the higher top at 0.73142 the price broke through the 15 and 34 Simple Moving Averages (SMA) and the Momentum Oscillator changed direction to the bearish side, both confirming a likely downward shift in market momentum.
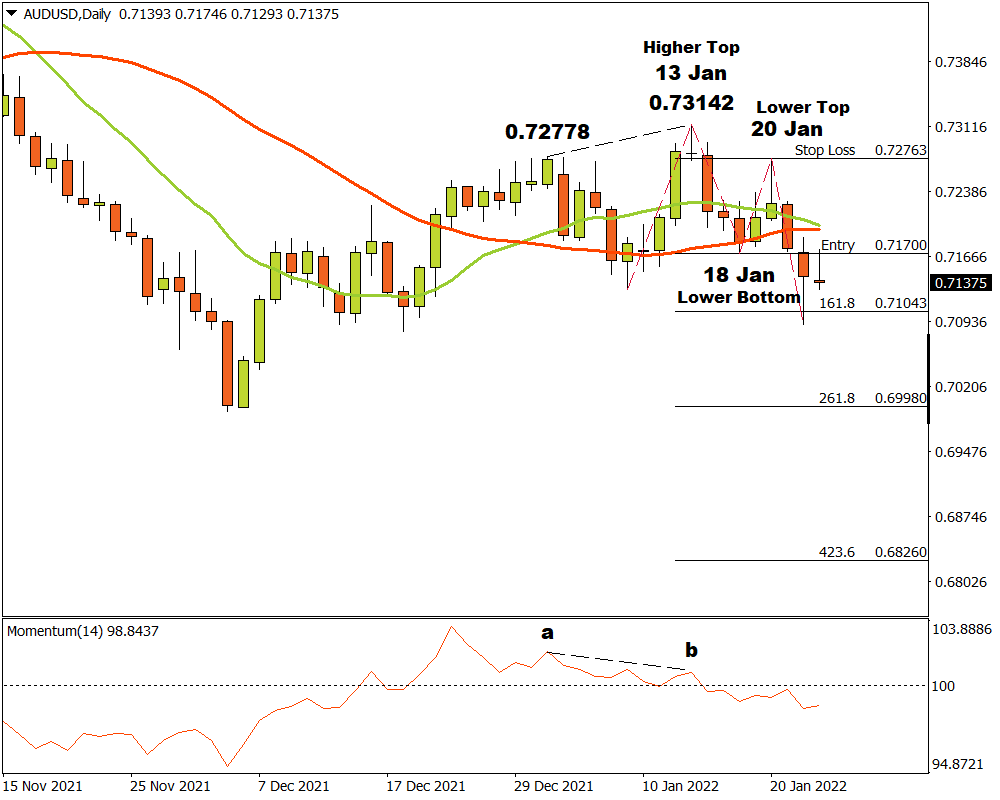
A possible critical support level formed when a lower bottom was recorded on 18 January at 0.71700. Bulls joined the market and herded the price higher until reaching the 100-day SMA resistance level on 20 November at 0.72763. At that point the bears come into the market again.
On 24 January the bears managed to break through the critical support level at 0.71700 and three possible price targets were projected from there. Attaching the Fibonacci tool to the lower bottom at 0.71700, and dragging it to the lower top at 0.72763, the following targets were calculated.
The first target was estimated at 0.71043 (161.8%) and this was reached on the same day. The second price target were calculated at 0.69980 (261.8%) and the third and final target may be expected at 0.68260 (423.6%). If the resistance level at 0.72763 is broken, the above scenario is annulled and any open risk should be removed. As long as the market participants maintain a negative sentiment, the outlook for Aussie on the D1 time frame should remain bearish.
Written on 25/1/2022 by Theunis Kruger, FX Trainer at FXTM
For more information, please visit: FXTM