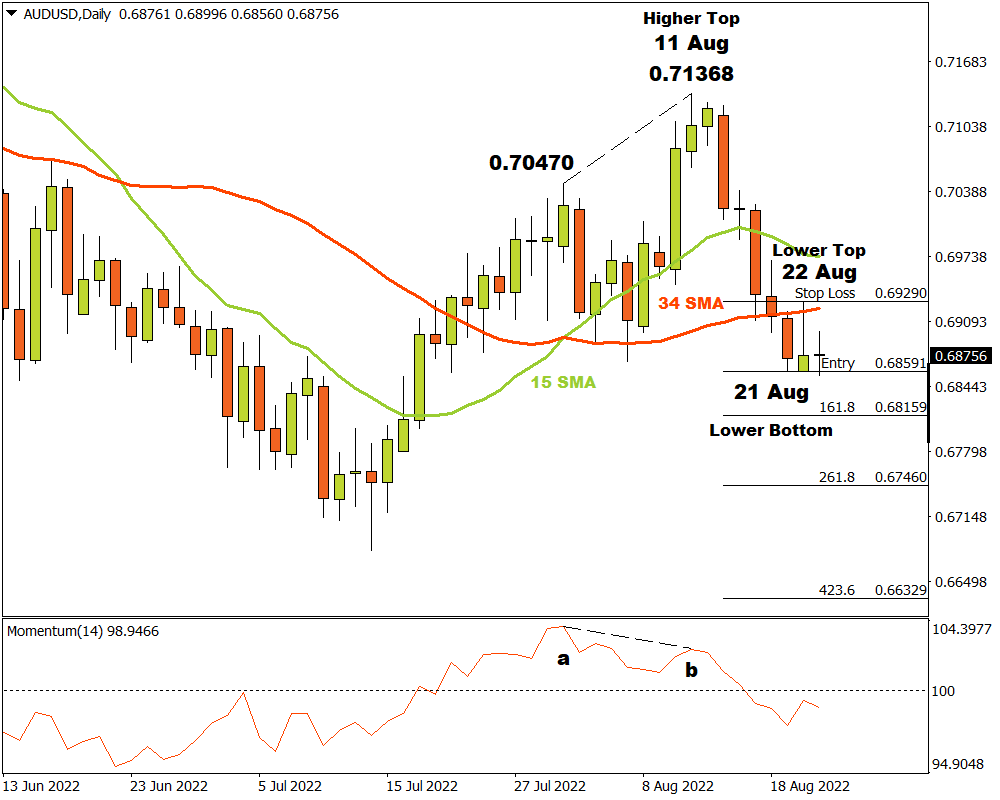
The AUDUSD on the D1 time frame was in an uptrend and made a higher top at 0.71368 on 11 August. Supply started overcoming demand at that point and a shift in momentum began. A closer look at the Momentum Oscillator reveals negative divergence between point “a” and “b” when comparing the tops at 0.70470 and 0.71368. This could have alerted technical traders that the bullish momentum was low.
After the top at 0.71368 the price broke through the 15 and 34 Simple Moving Averages (SMA) and the Momentum Oscillator changed direction to the downside, confirming a bearish shift in the market. A critical support level formed when a lower bottom was recorded at 0.68591 on 21 August. The bulls retaliated and the price formed a lower top on 22 August at 0.69290.
On 23 August the bears managed to just break through the support level at 0.68591 before retracing a bit. Three possible price targets can now be projected from there. Attaching the Fibonacci tool to the lower bottom at 0.68591 and dragging it to the lower top at 0.69290, the following targets can be calculated. The first target can be estimated at 0.68159 (161.8%). The second price target may be calculated at 0.67460 (261.8%) and the third and final target might be expected at 0.66329 (423.6%).
If the resistance level at 0.69290 is broken, the above scenario is void and must be reviewed. As long as the bears continue making lower top and bottoms, the outlook for AUDUSD on the D1 time frame will remain to the short side.
For more information, please visit: FXTM