The Cable on the H4 time frame had upward momentum until 18 November when the last higher top was recorded at 1.35136. A closer look at the Momentum Oscillator reveals a negative divergence between point a and b when comparing the higher tops at 1.34730 and 1.35136. This could have alerted technical traders that a possible reversal was on the books. After the higher top at 1.35136 the GBPUSD price broke through the 15 and 34 Simple Moving Averages with the Momentum Oscillator following close behind by changing direction to the down side.
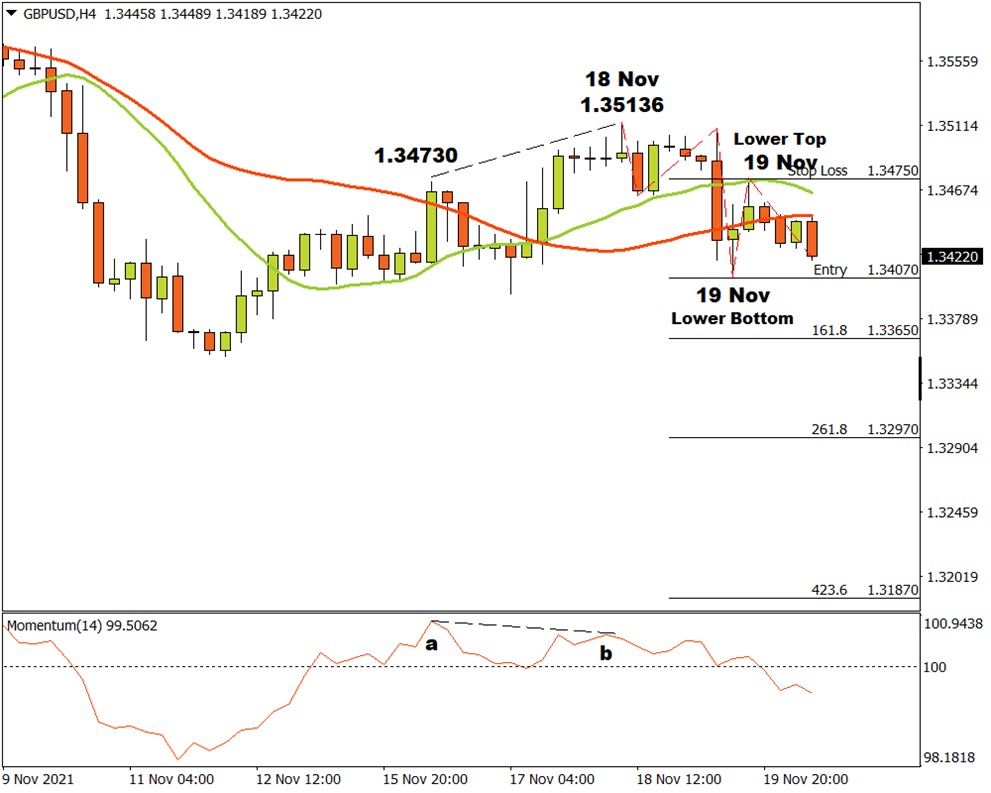
A possible critical support level formed when a bottom was recorded on 19 November at 1.34070. The bulls had some fight left but they could not take over and later on 19 November, a resistance level was hit at 1.34750. The bears are not ready to give up yet.
If the bears manage to break through the critical support level at 1.34070, then three possible price targets can be projected from there. Attaching the Fibonacci tool to the bottom at 1.34070, and dragging it to the resistance level at 1.34750, the following targets can be calculated.
The first target may be estimated at 1.33650 (161.8%). The second price target might be calculated at 1.32970 (261.8%) and the third and final target may be expected at 1.31870 (423.6%). If the resistance level at 1.33750 is broken, the above scenario is unacceptable and must be re-assessed. As long as bears do not give up and keep adding momentum to the Cable, the outlook for this market will remain bearish.