FxPro information and reviews
FxPro
89%
HFM information and reviews
HFM
85%
Just2Trade information and reviews
Just2Trade
77%
IronFX information and reviews
IronFX
77%
XM information and reviews
XM
76%
Alpari information and reviews
Alpari
76%

The US Dollar Index Chart. What is it, and how do you use it?


Many traders use indices in their trading. The stock market offers a huge variety of indices such as the S&P 500, NASDAQ, Dow Jones, etc. They provide a picture of the state of the economy in a particular industry or country.

What about the foreign exchange market? Here, the main assistant is the US Dollar Index (Basic Dollar Index, USDX). The US dollar is the world’s reserve currency, which means it is widely traded and is of interest to traders worldwide. For example, it is used in 80-90% of all Forex trading.

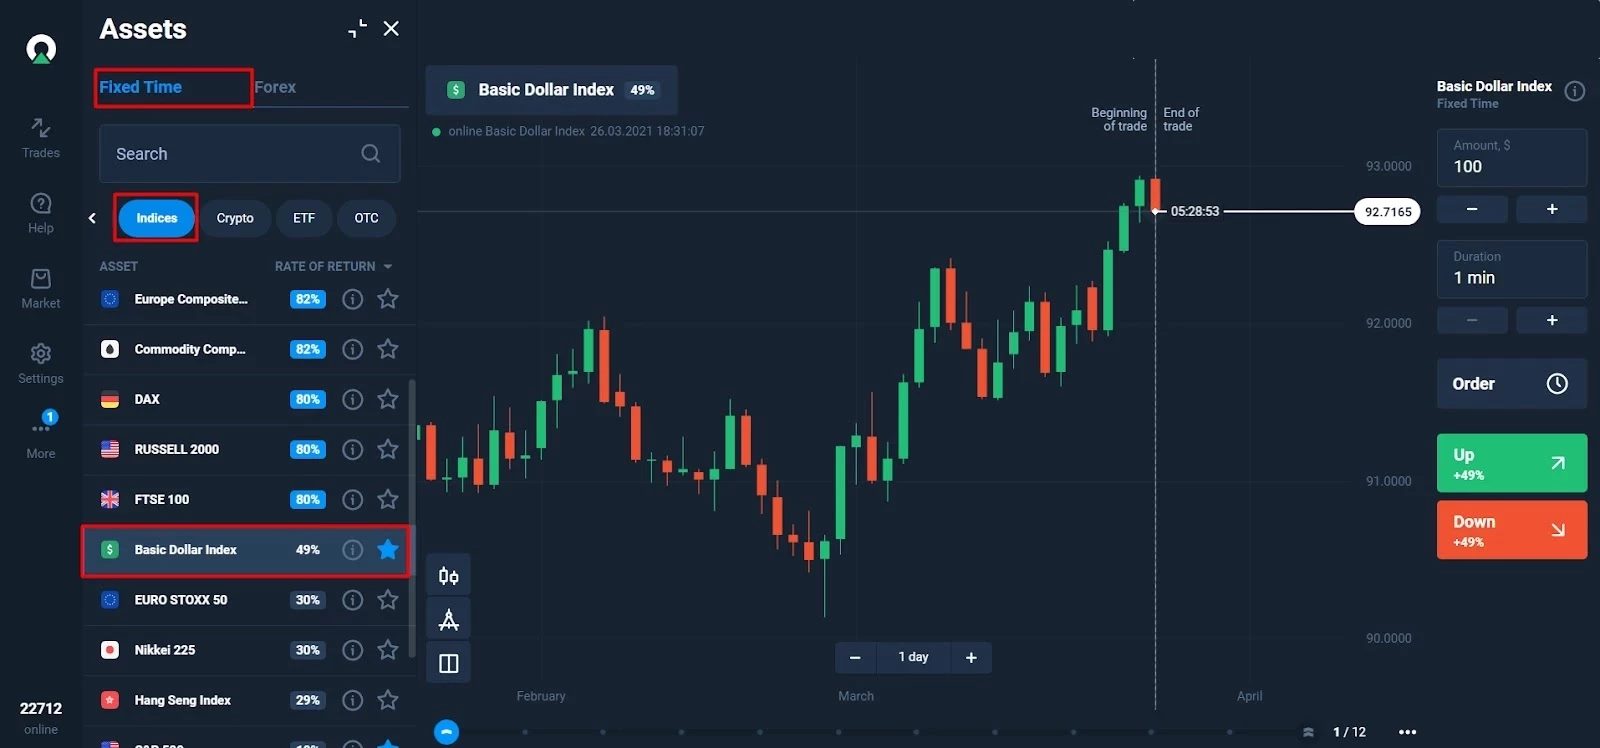
On the platform, the Dollar Index can be found in the FTT section under the Indices tab. On other platforms, you may find this instrument under USDX or DXY tickers.

Here is the US Dollar Index chart:

The Basic Dollar Index is a measure of the strength of the US currency. It includes a basket of foreign currencies whose value is compared to the value of the US dollar. Many professional traders follow its changes because it is often the strengthening or weakening of the dollar that sets the markets in motion.

How Is the Dollar Index Calculated?

The index is calculated as a weighted geometric mean of the currency basket. The index basket includes six currencies: euro (EUR), yen (JPY), pound sterling (GBP), Canadian dollar (CAD), Swedish krona (SEK), and Swiss franc (CHF). The list corresponds with the countries that are the main trading partners of the United States. They have a different economic impact on the US economy, so each currency is assigned a specific share:

The final formula for the index looks like this: USDX = 50.14348112 × EURUSD-0.576 × USDJPY0.136 × GBPUSD-0.119 × USDCAD0.091 × USDSEK0.042 × USDCHF0.036

When and Why Was the Dollar Index Created?

JP Morgan developed it in March of 1973. If you substitute the exchange rates for March 1973 in the formula, you get precisely the value of 100. It turns out that the Basic Dollar Index shows the change in USD in relation to a basket of currencies compared to the 1973 quotes.

An index value of fewer than 100 points indicates a weakening of the dollar whereas more than 100 points indicates an increase in the value of the US dollar compared to 1973. At this point, there was a transition to floating exchange rates. The Bretton Woods agreement, when the US dollar was tightly pegged to the value of gold ($35 per troy ounce), ended, and the gold standard has sunk into oblivion.

After adopting the Smithsonian Agreement, the range of currency fluctuations expanded from 1% to 4.5%. Subsequently, the Jamaican system was implemented, which assumes the market formation of exchange rates. The index was revised once again in 1999 when the euro was introduced. Thus, 19 more Eurozone countries were taken into account in the calculation, plus nine countries that use the euro but are not Eurozone members.

How to Use the Dollar Index in Trading

The Basic Dollar Index can be used to analyze the Forex market. This is similar to how stock market investors use indices to determine the general direction of the markets. The Forex market is highly dependent on the fluctuations of the US currency, and you have to understand this if you are going to make fundamental analysis as a basis for your trades.

Suppose you trade currency pairs using USD as one of the currencies (EUR/USD, GBP/USD, USD/CHF, etc.). In that case, the Basic Dollar Index will be an indispensable assistant for determining the trend, levels, and movement potential.

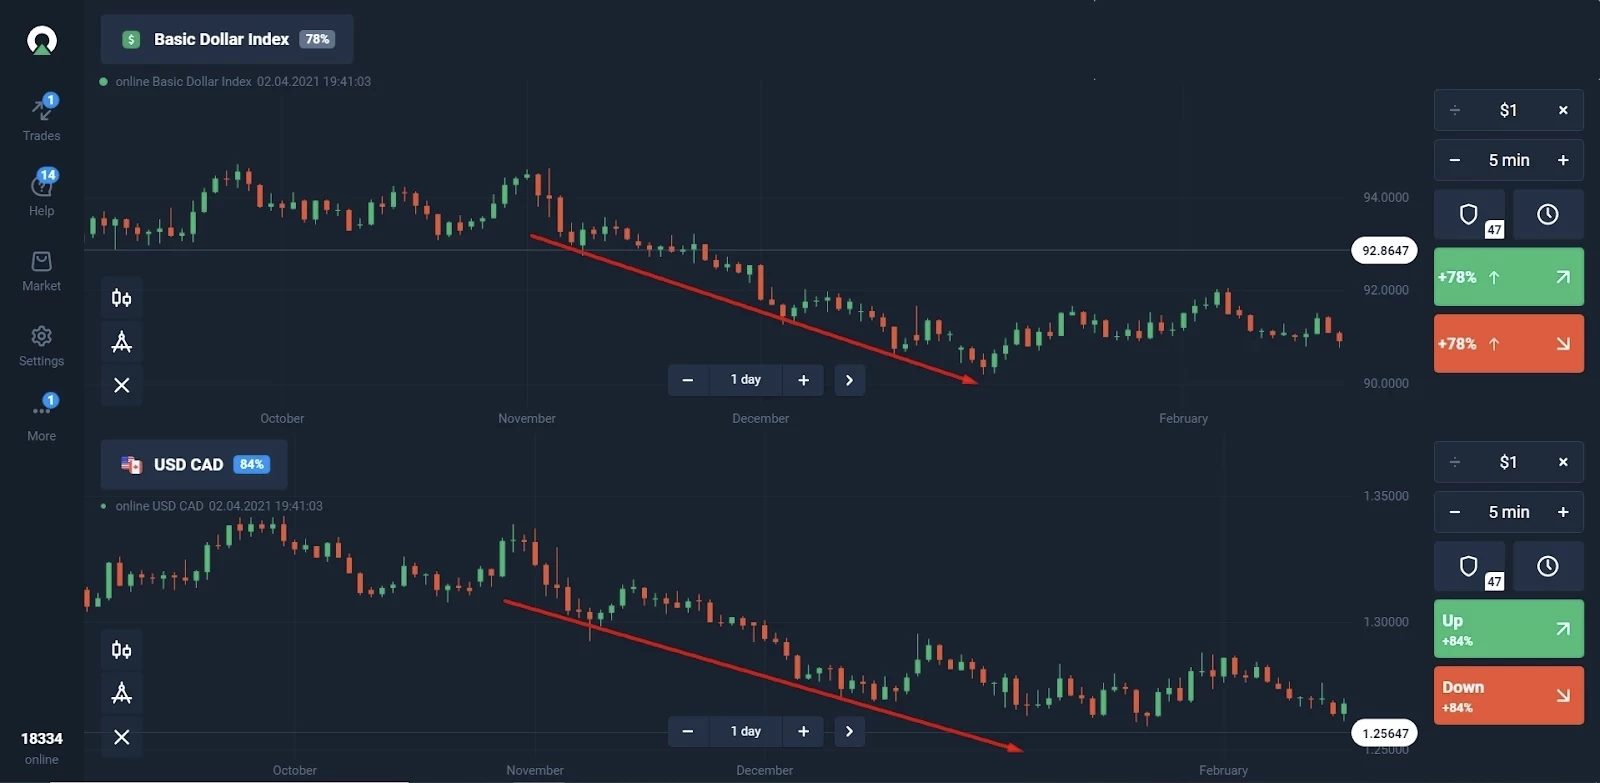
It can be argued that the index is highly correlated with such currency pairs. The correlation will be positive if USD is the asset’s base currency (comes first in the pair). Below is an example of a positive correlation with USD/CAD and the US Currency Index:

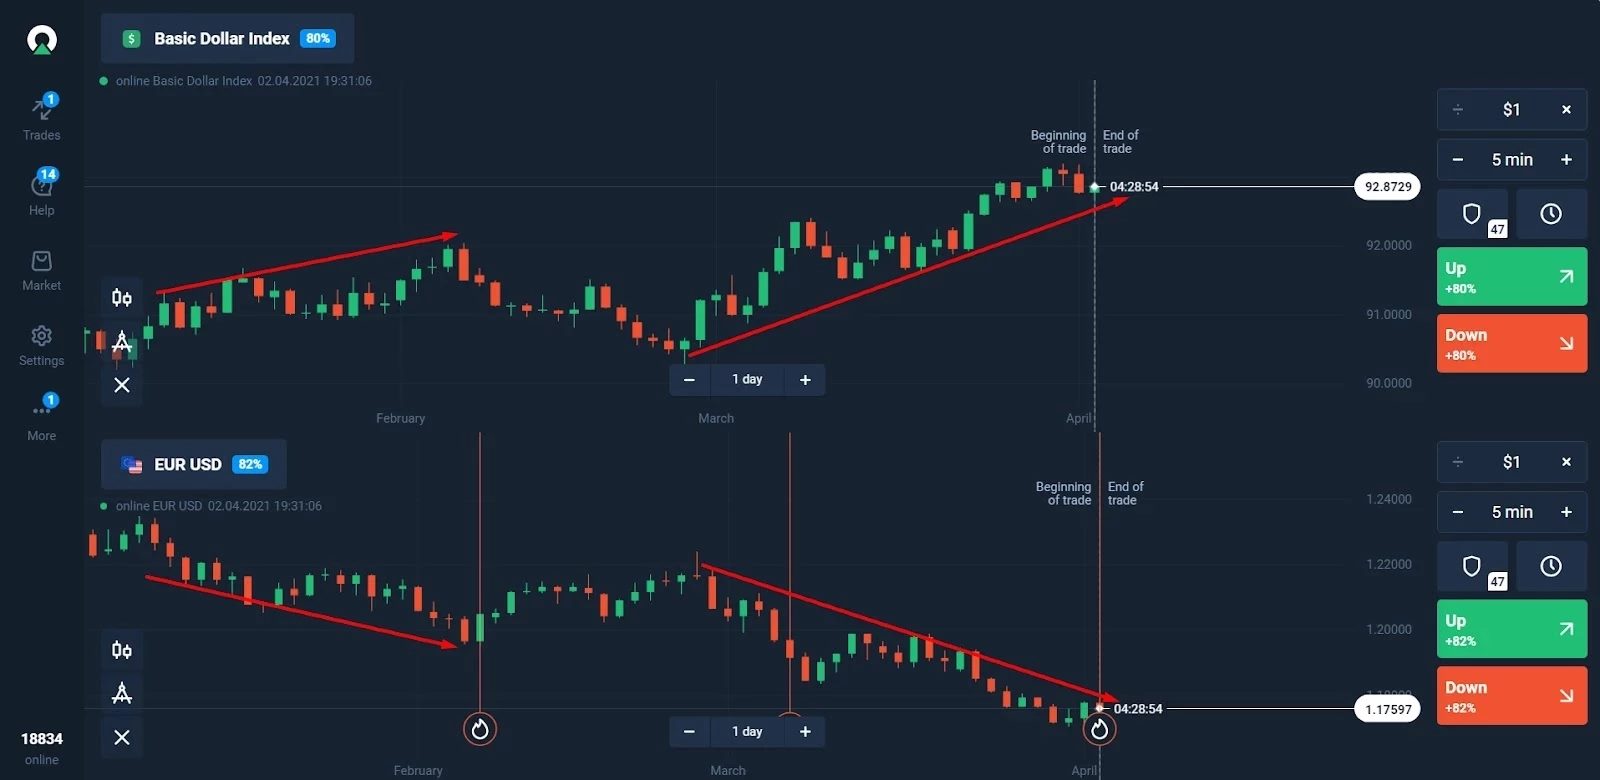
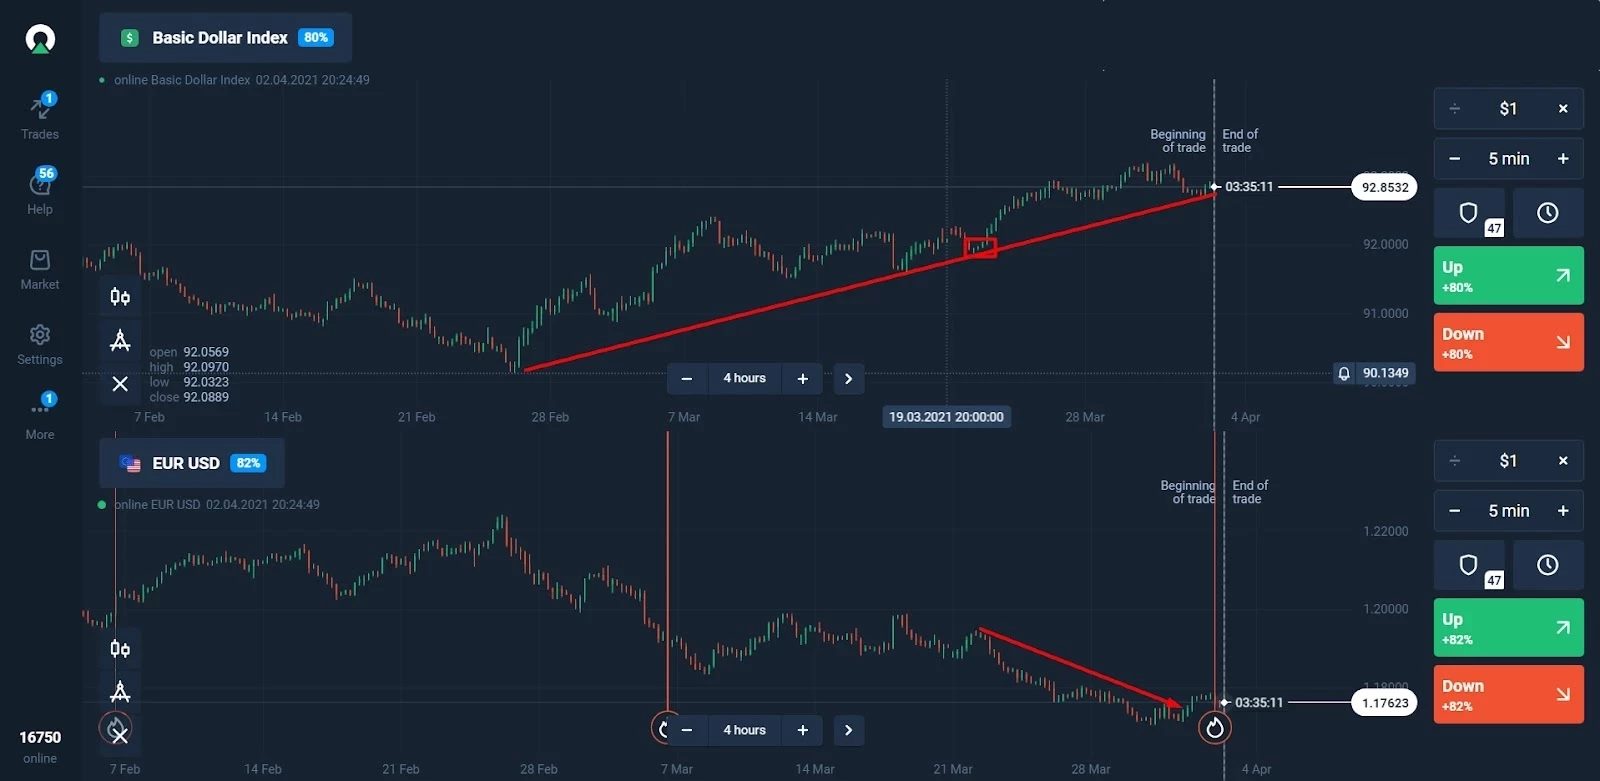
If USD is the quoted currency (second place of the pair), then the correlation of such an asset with the Basic Dollar Index will be negative. The greatest negative correlation is observed with EUR/USD since the weight of the EUR in the index is 57.6% as illustrated here:

There are two main methods to trade with the US Dollar Index. Let’s analyze them using the example of trading with the EUR/USD pair:

Method 1. From time to time, movement in the index anticipates movements in major currency pairs. The Basic Dollar Index may break through a strong support or resistance level or simply start an active move. If a similar movement is not observed in the EUR/USD, then there is a reasonably high probability that it will start soon (in the opposite direction). You may trade EUR/USD lag using the FTT tool by analyzing the chart on a timeframe of at least 1 hour.

Method 2. The primary strategy for trading with the Basic Dollar Index is to identify trend lines and support and resistance levels. You should open positions for an increase in the EUR/USD:

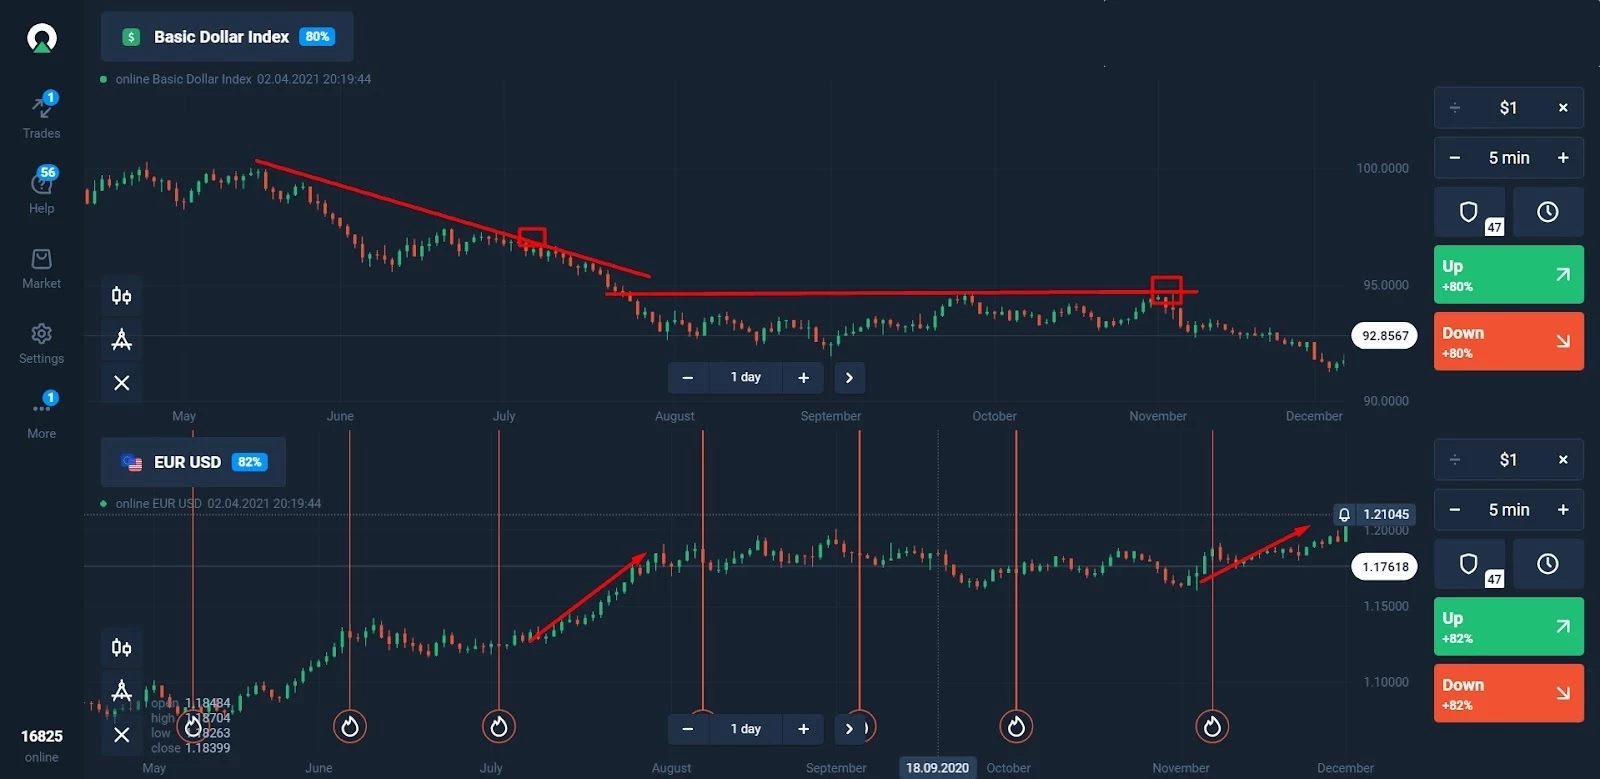
Downward positions in EUR/USD should be opened:

You will need to analyze charts to find entry points on high timeframes starting from 4 hours. The preferred timeframe is 1 day, which is why it is better to trade using Forex mode instead of FTT.

The most important thing to remember is that the Basic Dollar Index is primarily a macroeconomic indicator. It is used to assess the global state of the US dollar for higher timeframes and is often used as a complement to other fundamental analysis.

#source


RELATED

Mastering The 50-Day Moving Average And Its Applications in 2023

In the ever-evolving realm of financial markets, gaining a deep understanding of various tools and indicators is essential for deciphering price trends and making informed decisions...

Support and resistance indicators: how to trade S&R in Forex

Support and resistance levels are one of the most important concepts in Forex trading. Many technical tools rely on support and resistance lines to find or to confirm trade setups...

Leverage and Margin in Forex

Leverage and margin are the terms each trader starts with. The concept is simple, so even a beginner trader will catch on fast. However, there are pitfalls that may affect traders...

Stop Orders Demystified: A Comprehensive Examination

In the intricate tapestry of financial markets, an arsenal of tools and techniques awaits traders and investors. Among these, trading orders serve as the backbone of any robust trading strategy...

Elliott Waves for Forex Market Analysis

Studying the Forex market, it is easy to notice that the price movement on it occurs in waves. For decades many traders have been trying to find...

Stop Loss In Trading: How To Say No

Almost all experienced traders of the forex market agree that it is necessary to set stop losses in any style of trading. Beginners, newcomers to the market, often neglect this rule...

Moving averages explained

Learn how to trade with one of the most popular Forex indicators - Moving Averages. In this article, we explain how to use moving averages as a technical analysis...

Bullish and Bearish Divergence: How to Catch a Signal

In analytics, there is a chance you’ll come across the term divergence. Divergence is one of the well-known market conditions that provide reliable signals...

Support and Resistance Levels: Comprehensive Overview and Practical Approaches

Support and resistance levels are paramount concepts, pivotal in navigating Forex and various financial markets. These levels underpin myriad trading strategies and form the foundational framework...

Bull Flag Pattern in Trading - Open Long Trades

In the world of technical indicators and patterns, finding a reliable, workable tool that would help you predict price direction is challenging. However, they exist...

Fundamental and Technical Analysis

When it comes to analysing the financial markets there are two primary approaches used. One is technical analysis and the other is fundamental analysis, and they are quite...

What Are Order Blocks In Forex? Unraveling the Impact of Big Market Players

In the vast and intricate world of Forex trading, the presence of order blocks plays a crucial role in shaping market dynamics. Introduced by large financial institutions and central banks...

Three technical indicators you should know about

Seeing a list of indicators, you might easily get lost. This article will help you learn about 3 essential indicators that will help you define your trading strategy for any time period...

Depth Of The Market: Definition And Meaning

Depth of the Market is a special technical indicator developed for the MetaTrader 4 terminal. It is designed to monitor the current price movement and also to determine the supply and demand zones...

Basics of Options Trading: Understanding Put vs Call Option

A popular tool for speculation is options trading, where money can move fast, and traders can gain (or lose) their stakes quickly. But what are options contracts...

Beautiful Signals of the Butterfly Pattern

The butterfly pattern. It sounds nice, doesn't it? However, the real hides many difficulties for traders, especially for newbies. It's not a common trading tool...

A matrix to understand the Gold market

US investment bank Morgan Stanley produced a research note yesterday detailing that they see a period where real US bond yields rise in the near-term...

Technical analysis: Beginners Guide

By definition, technical analysis is the forecasting of the future price action of an underlying financial asset based on its past price behaviour. Essentially, technical...

Which indicator is best for forex trading

Success is what everybody wants when first enter the forex market. Just for success they do learn how to trade themselves, hire brokers and cooperate with each other...

Three types of Forex analysis

Getting your head wrapped around Forex analysis isn't easy. Especially if you're a novice trader. That is why it is so vital to learn Forex step by step and understand...

Riverquode information and reviews
Riverquode
75%
Moneta Markets information and reviews
Moneta Markets
75%
FXTM information and reviews
FXTM
75%
FXCC information and reviews
FXCC
75%
FXCess information and reviews
FXCess
75%
Fintana information and reviews
Fintana
74%

© 2006-2026 Forex-Ratings.com

The usage of this website constitutes acceptance of the following legal information.
Any contracts of financial instruments offered to conclude bear high risks and may result in the full loss of the deposited funds. Prior to making transactions one should get acquainted with the risks to which they relate. All the information featured on the website (reviews, brokers' news, comments, analysis, quotes, forecasts or other information materials provided by Forex Ratings, as well as information provided by the partners), including graphical information about the forex companies, brokers and dealing desks, is intended solely for informational purposes, is not a means of advertising them, and doesn't imply direct instructions for investing. Forex Ratings shall not be liable for any loss, including unlimited loss of funds, which may arise directly or indirectly from the usage of this information. The editorial staff of the website does not bear any responsibility whatsoever for the content of the comments or reviews made by the site users about the forex companies. The entire responsibility for the contents rests with the commentators. Reprint of the materials is available only with the permission of the editorial staff.
We use cookies to improve your experience and to make your stay with us more comfortable. By using Forex-Ratings.com website you agree to the cookies policy.