HFM information and reviews
HFM
96%
FXCC information and reviews
FXCC
92%
FxPro information and reviews
FxPro
89%
XM information and reviews
XM
86%
Exness information and reviews
Exness
86%
FP Markets information and reviews
FP Markets
81%

A Pullback: Trade Against a Trend


Tom Tragett   Written by Tom Tragett

Reading analytical outlooks on the price movements, you might be met with the word “pullback”. Many trading strategies are based on a pullback action. Pullbacks allow you to trade against the trend. Do you think that it’s wrong as the theory teaches you to follow the primary trend? What is a pullback actually? Keep reading to learn about tricky pullbacks.

Pullback: Definition

If you are familiar with a price chart, you know that an asset never goes straight. It moves up and down even within trends. Look at the image below. We have a strong uptrend. Every time the price goes down, it’s a pullback.

USD/JPY H4 Chart

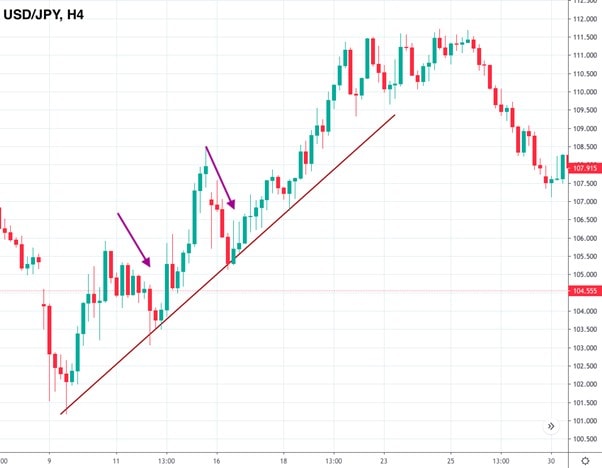
A pullback is a short-term price movement against the primary trend.

You should already be able to catch the pullback meaning from the explanation above. Simply stated, a pullback is a movement against the primary trend for a short period of time.

Triggers of Pullbacks

We can say that a pullback is a pause of the primary trend. It means that bulls in a downtrend and bears in an uptrend take control over the price for a while. There can be several reasons why the price changes its direction. To predict a pullback, you should learn about fundamental analysis. 

Pullbacks occur due to a change in market sentiment. 

Pullbacks: Real Examples 

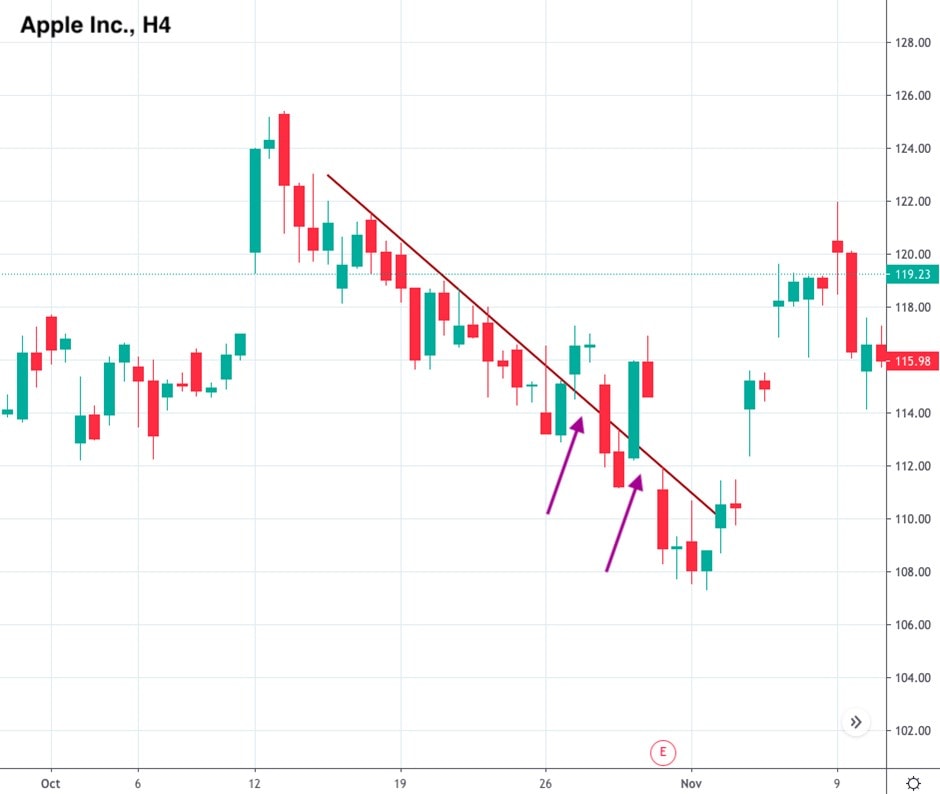
To predict pullbacks, you should know how to analyze price movements. Let’s consider a real example of a pullback. Pullbacks occur not only on currency charts, but on the chart of any financial asset. Consider an example of a pullback stock trading. It’s a four-hour chart of Apple stocks. As you can see a pullback may also happen in the downtrend. Moreover, during a pullback candlesticks can break above resistance or below support, but later return. 

Apple stocks H4 Chart

Pullbacks: Benefits and Drawbacks 

A pullback is a complicated pattern that has more disadvantages, especially for a beginner trader. 

Benefits

Drawbacks

Better conditions. A pullback allows traders to buy at a lower price in an uptrend and sell at a higher price during a downtrend. 

Imagine you couldn’t catch the beginning of the uptrend but still would like to enter the market. The price moves up in the upward trend; thus, every time the peak is formed, your chances to buy at an appropriate price reduces. 

However, when a pullback happens, you get an opportunity to get a lower price. 

Pullback or reversal? It’s not easy to determine whether it’s a pullback or a reversal, especially for newbies in the Forex market. 

Imagine you thought the market turned down for a short-term and kept your trade open expecting the trend will continue. 

However, it was a trend reversal, and you suffered significant losses. 

Difficult to predict. It’s hard to predict the beginning of the pullback and its end. You can easily miss the point when the trend resumes. 

Why to trade with Libertex?

#source


RELATED

Do you follow the Trend Lines?

Looking for ways to boost your technical analysis skills? Keep reading to see if trend lines are part of your trading strategy!

Choosing a Trading Instrument: How to Trade Indices

By now, you must be familiar with the names of the world's major stock indices: Dow Jones, S&P 500, NASDAQ, DAX30. But did you know that they...

How to Use the US Dollar Index (DXY) in Trading

The US Dollar is the most traded currency in the world. It is used as a currency of the majority of international transactions while also being part of the most popular currency pairs on the Forex market...

T4Trade: What is Market Analysis in Forex

In this article, we discuss what is market analysis in forex and go into detail regarding fundamental and technical analysis...

Technical analysis: Beginners Guide

By definition, technical analysis is the forecasting of the future price action of an underlying financial asset based on its past price behaviour. Essentially, technical...

Awesome Oscillator: Strategies & Uses

The awesome oscillator is a market momentum indicator that is used to define reversals and corrections of the price. It's one of the easiest but most effective trading tools...

Stop Loss In Trading: How To Say No

Almost all experienced traders of the forex market agree that it is necessary to set stop losses in any style of trading. Beginners, newcomers to the market, often neglect this rule...

Currency Strength Meter: Complete Guide

Any trader needs to define the direction of the currency pair. It is also important to remember that the market movement is defined by the strength and weakness...

Best Trading Indicators: A Guide to the 17 Most Popular Technical Analysis Tools

In the intricate world of financial trading, one can easily get overwhelmed by the enormous amounts of data flooding the markets daily. Technical analysis offers a structured approach...

A matrix to understand the Gold market

US investment bank Morgan Stanley produced a research note yesterday detailing that they see a period where real US bond yields rise in the near-term...

Technical analysis: what separates the pros from the schmoes

In essence, technical analysis hinges on the study of past price movements and trends to predict future market developments. It first emerged as a tradition...

Mastering the Intricacies of Short-Term Trading Analysis

In the bustling corridors of the financial world, short-term trading stands out as a high-octane race, demanding lightning-fast reflexes, unwavering focus, and an adept understanding of market nuances...

Unlocking the Power of Technical Analysis in Trading

Technical analysis, often regarded as a cryptic endeavor for newcomers to the world of capital markets, is an essential tool for traders and investors seeking insights...

Introduction to technical analysis in forex trading

Learn how traders use technical analysis to enhance their strategies and make informed trading decisions...

Japanese Candlestick Chart Analysis

The most convenient option for charting any asset on Forex is Japanese candles. The information content and the state of the market's data...

The role of a technical analyst

Forex traders use technical analysis to forecast future price movements of financial assets based on historical market data. It involves analysing trends, patterns...

The Ascending Triangle Pattern in Trading

Investors tend to use different tools to define the market direction. Technical indicators, candlesticks and chart patterns are all key to successful trading...

What Is a Bear Trap in Trading and How to Handle It?

You may have heard of a bull trap, but if you haven't, we recently covered this topic in an article. In this guide, we'd like to tell you about the opposite event in the market: a bear trap...

Three types of Forex analysis

Getting your head wrapped around Forex analysis isn't easy. Especially if you're a novice trader. That is why it is so vital to learn Forex step by step and understand...

FTSE 100 Predictions for 2021 and Beyond

Stock market returns in 2020 were eerily similar to what happened in 2009. We're seeing some strength emerging from a deep stock market recession. Even though...

IronFX information and reviews
IronFX
77%
AMarkets information and reviews
AMarkets
76%
Just2Trade information and reviews
Just2Trade
76%
T4Trade information and reviews
T4Trade
75%
Riverquode information and reviews
Riverquode
75%
FXCess information and reviews
FXCess
75%

© 2006-2026 Forex-Ratings.com

The usage of this website constitutes acceptance of the following legal information.
Any contracts of financial instruments offered to conclude bear high risks and may result in the full loss of the deposited funds. Prior to making transactions one should get acquainted with the risks to which they relate. All the information featured on the website (reviews, brokers' news, comments, analysis, quotes, forecasts or other information materials provided by Forex Ratings, as well as information provided by the partners), including graphical information about the forex companies, brokers and dealing desks, is intended solely for informational purposes, is not a means of advertising them, and doesn't imply direct instructions for investing. Forex Ratings shall not be liable for any loss, including unlimited loss of funds, which may arise directly or indirectly from the usage of this information. The editorial staff of the website does not bear any responsibility whatsoever for the content of the comments or reviews made by the site users about the forex companies. The entire responsibility for the contents rests with the commentators. Reprint of the materials is available only with the permission of the editorial staff.
We use cookies to improve your experience and to make your stay with us more comfortable. By using Forex-Ratings.com website you agree to the cookies policy.