HFM information and reviews
HFM
96%
FXCC information and reviews
FXCC
92%
FxPro information and reviews
FxPro
89%
FBS information and reviews
FBS
88%
Vantage information and reviews
Vantage
85%
XM information and reviews
XM
82%

The Double Top Pattern: An In-Depth Guide to Mastering a Timeless Reversal Signal


Sandro Pontedra   Written by Sandro Pontedra

While it's often claimed that markets are unpredictable, there's a method to the madness. Certain price chart patterns like the double top pattern offer a systematic way to read market movements, acting as historical footprints that signal future trends. Recognizing such patterns can greatly benefit traders, particularly in the volatile realm of margin trading where capitalizing on both upward and downward trends can yield significant returns.
The Double Top Pattern: An In-Depth Guide to Mastering a Timeless Reversal Signal

A Primer on Technical Analysis: The Building Blocks

Before diving into the specifics of the double top pattern, it’s essential to have a solid grasp of technical analysis. Technical analysis is the science and art of forecasting market trends through the study and interpretation of historical price data, usually in the form of price charts. The methodology primarily operates under the basic economic principles of supply and demand.

Understanding Chart Patterns vs. Technical Indicators

Chart patterns are different from technical indicators, though both are crucial tools in technical analysis. Chart patterns like the double top are formed through the plotting of price points over time, which can be represented through candlesticks or line graphs. On the other hand, technical indicators involve mathematical formulas translated into graphical data, often overlaid on the price chart.
Zooming In: What is the Double Top Pattern?

Support and Resistance: The Fundamental Pillars

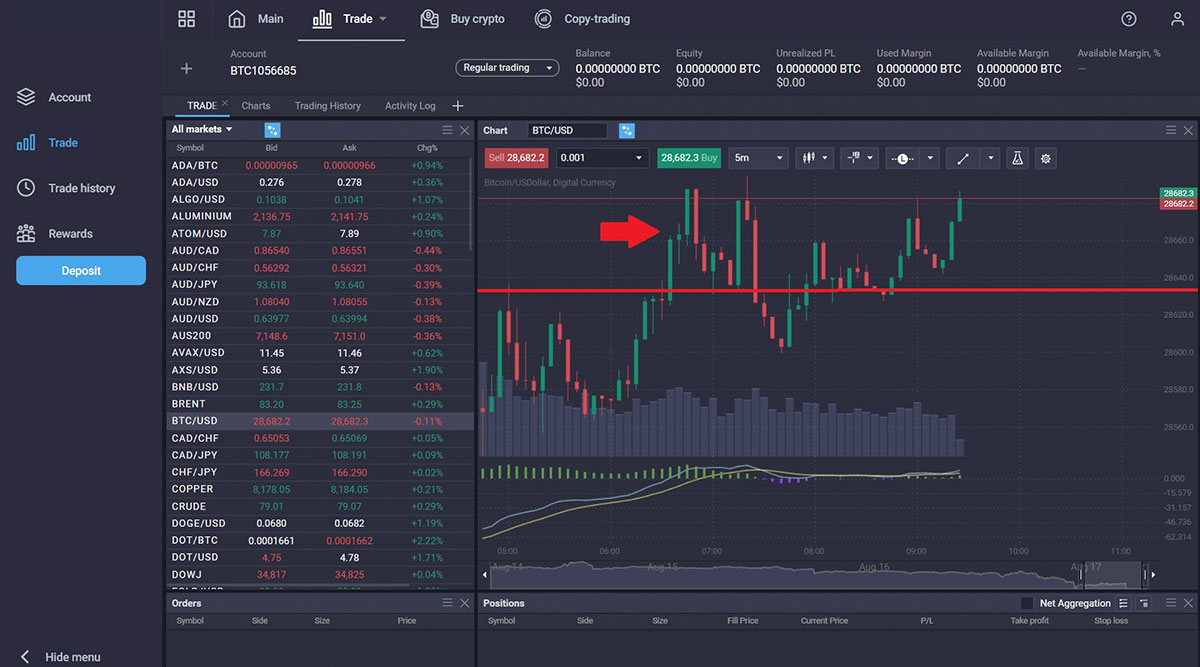
In technical analysis, price movements gravitate around two essential points: support and resistance levels. The support level serves as a safety net, where buying interest is significantly strong and surpasses the selling pressure, halting the price from falling further. On the flip side, the resistance level acts as a ceiling, halting the price from rising any further due to increased selling pressure.
Support and Resistance: The Fundamental Pillars

A well-established support or resistance level is often validated after it has been 'tested' multiple times. Contrary to this, the validation is often bypassed when specific chart patterns like the double top form.

Decoding the Double Top Pattern: Anatomy and Nuances

What Defines a Double Top?

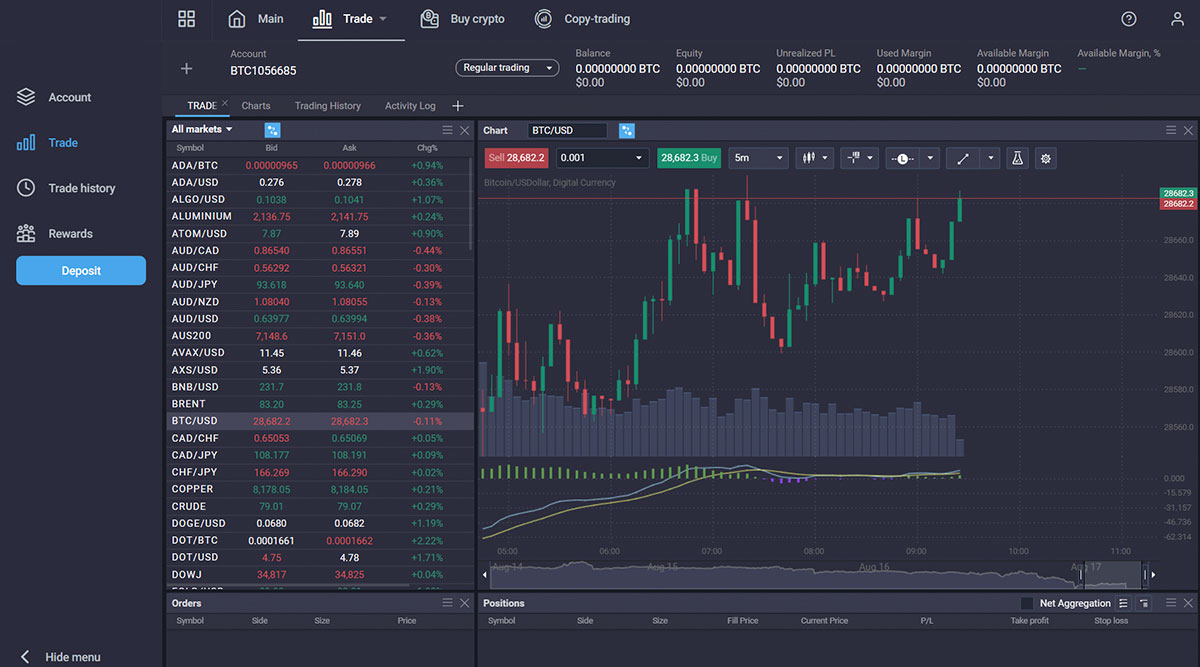
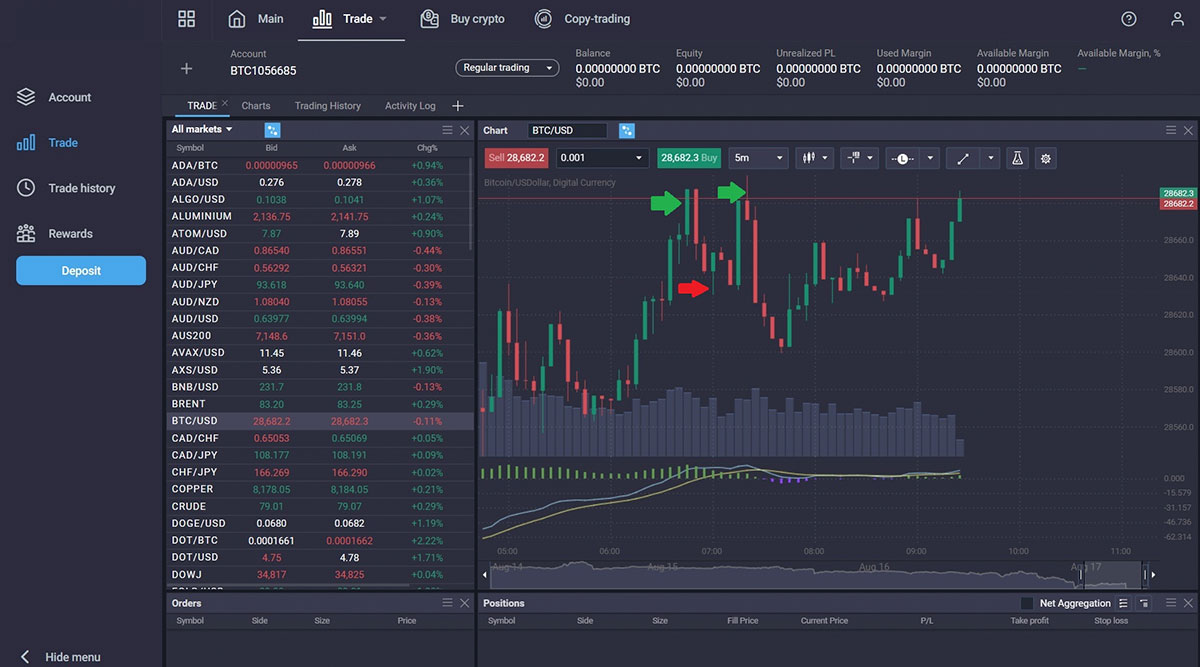
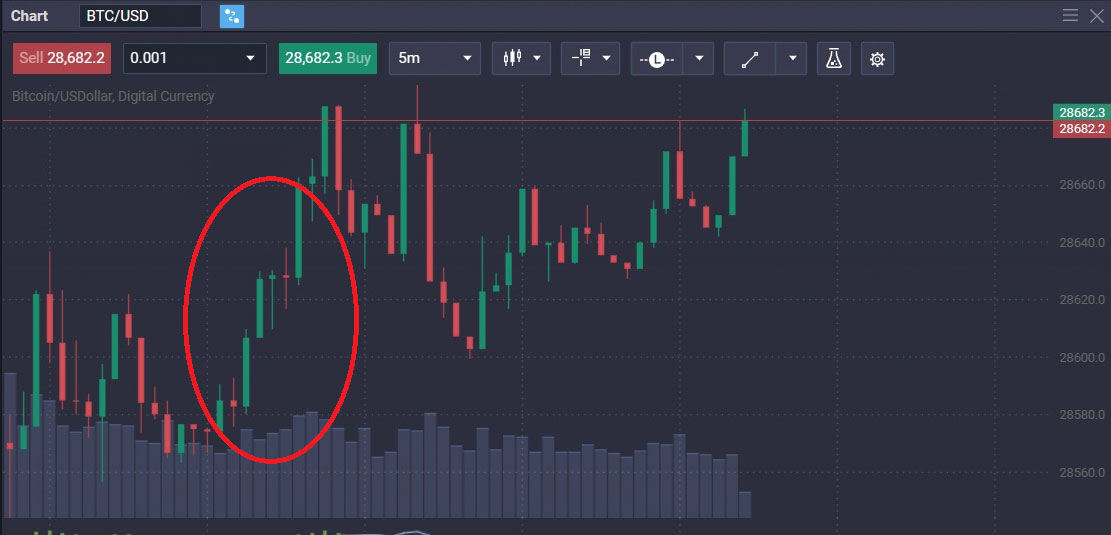
In essence, a double top pattern is a bearish reversal chart pattern characterized by two consecutive peaks. This pattern occurs after a strong uptrend and signals the impending reversal to a downtrend.
Defining the Double Top

Key Features of the Double Top Pattern

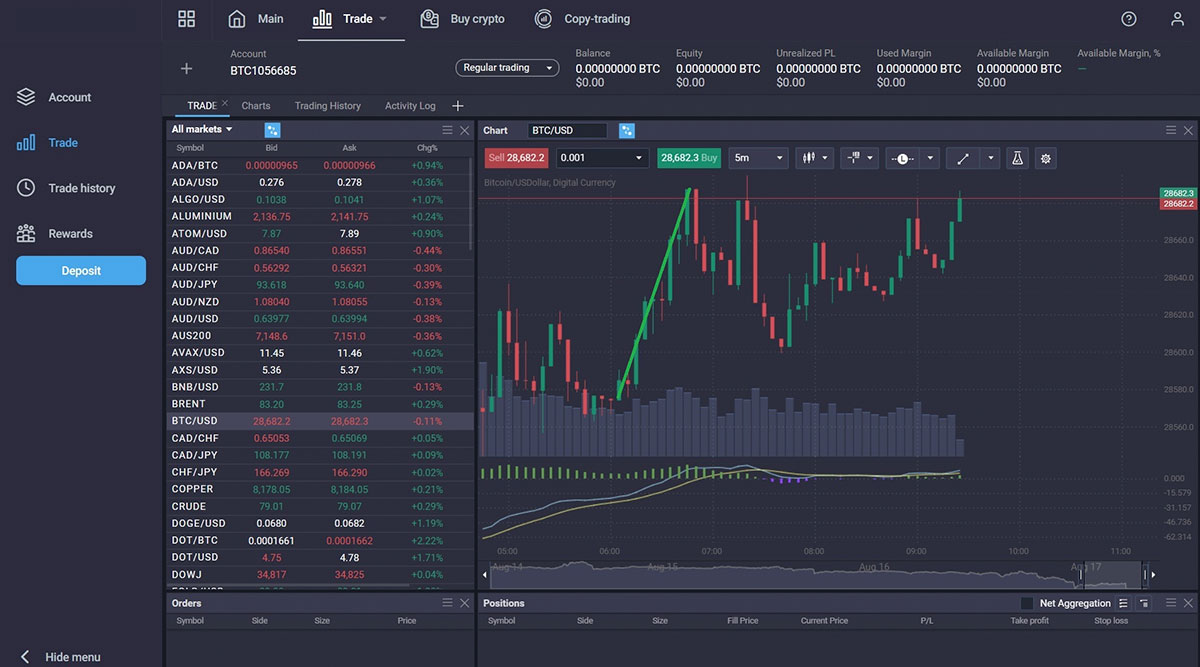
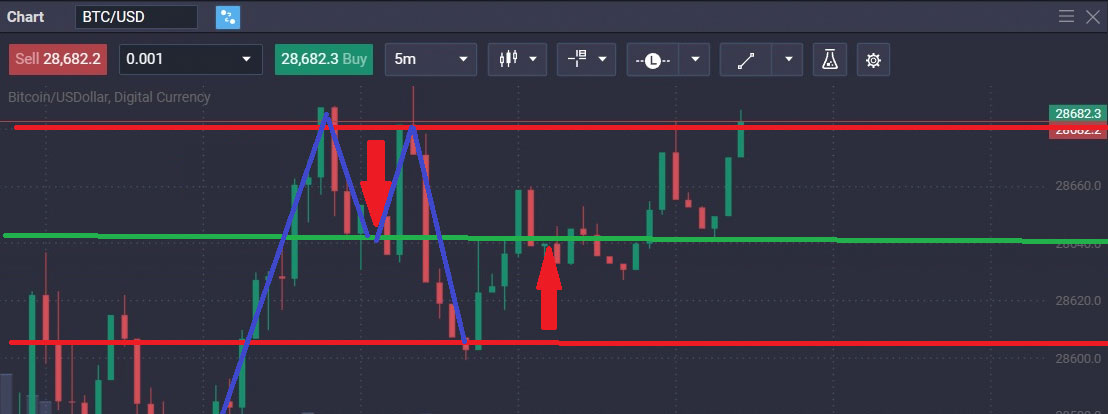
In the image you can see the clearly defined uptrend denoted with a green line

Stages of Formation

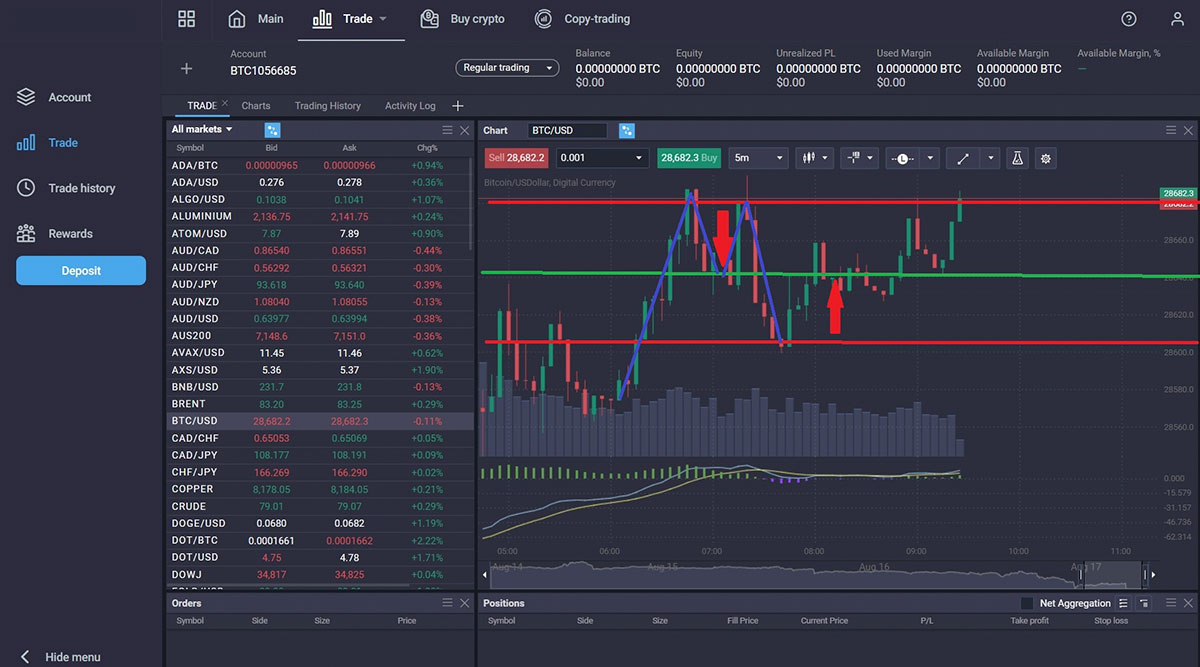
You’ll notice that the top red line and green line are support and resistance levels as the double top is developing

Practical Applications: How to Trade the Double Top Pattern

Strategic Entry and Exit

It's crucial to note that while the pattern’s formation might be underway, one should wait for confirmation before entering a trade. The pattern is fully confirmed when the price breaks below the neckline support level. Once the pattern is confirmed, one could consider taking a short position.

Risk Management: Stop-Loss and Target Prices

The importance of setting up a stop-loss can’t be overstated. A well-placed stop-loss will limit potential losses if the pattern proves to be false. Ideally, the stop-loss should be placed just above the neckline or the last highest point, depending on your risk tolerance.
Key Characteristics of the Double Top

Common Pitfalls and Precautions

Mistaking Similar Patterns

Many traders confuse the double top pattern with other patterns like the 'Head and Shoulders.' It's essential to wait for complete formation and confirmation to avoid such errors.
Formation and Anatomy of the Double Top

Double Top vs. Double Bottom

While the double top pattern indicates a reversal from a bullish to a bearish trend, its counterpoint, the double bottom, indicates a bearish to bullish reversal, forming a ‘W’ shape.
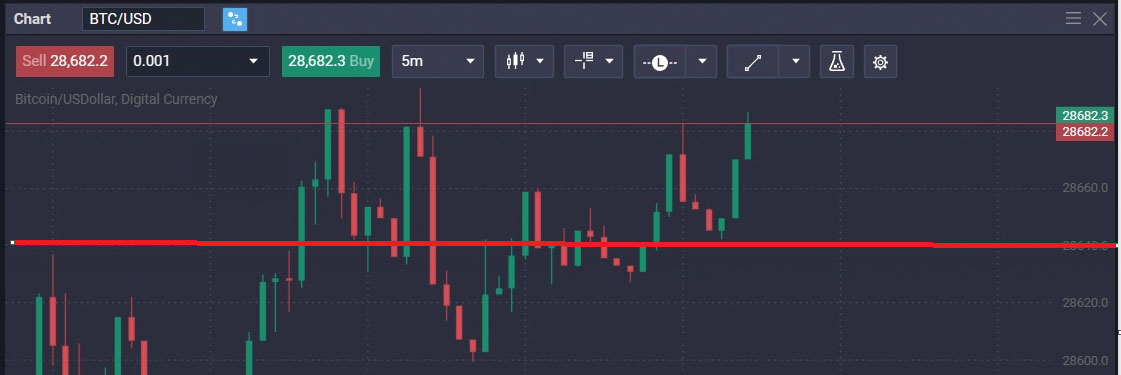
Setting Stop-Losses and Target Prices

Conclusion: The Versatility of the Double Top

The double top pattern holds a significant place in a trader’s toolkit. Its straightforward identification and historical reliability make it an essential pattern for traders ranging from novices to experts. Like any tool, its effectiveness is magnified when used wisely and in conjunction with other forms of analysis.

FAQ: Quick Reference Guide

Disclaimer: This guide is for educational purposes only and should not be considered as financial advice. Always consult with a certified financial advisor before making any investment decisions.

RELATED

Support and Resistance Levels: Comprehensive Overview and Practical Approaches

Support and resistance levels are paramount concepts, pivotal in navigating Forex and various financial markets. These levels underpin myriad trading strategies and form the foundational framework...

A Pullback: Trade Against a Trend

Reading analytical outlooks on the price movements, you might be met with the word “pullback”. Many trading strategies are based on a pullback action...

Sentiment analysis for Forex traders

There are many ways to level up your Forex skills, but defining the trends is a necessity if you want to place successful orders. So, how do you identify a trend...

What is Fundamental Analysis?

Understanding the core of an activity always makes it easier to do it regardless of how complicated it is. That is the case with fundamental analysis. While it may be done through...

How to Use the US Dollar Index (DXY) in Trading

The US Dollar is the most traded currency in the world. It is used as a currency of the majority of international transactions while also being part of the most popular currency pairs on the Forex market...

What Is MACD Indicator and How It Works?

The Moving Average Convergence Divergence (MACD) is a technical indicator that measures a relationship between two exponential moving averages...

Fundamental and Technical Analysis

When it comes to analysing the financial markets there are two primary approaches used. One is technical analysis and the other is fundamental analysis, and they are quite...

Technical analysis: what separates the pros from the schmoes

In essence, technical analysis hinges on the study of past price movements and trends to predict future market developments. It first emerged as a tradition...

Unlocking the Power of Technical Analysis in Trading

Technical analysis, often regarded as a cryptic endeavor for newcomers to the world of capital markets, is an essential tool for traders and investors seeking insights...

Technical Analysis Tools

Read on to find out about some of the most popular technical analysis tools that traders can use, such as Bollinger Bands, MACD, and RSI...

Forex Market: Is Technical Analysis Dead?

Every year the confidence of many traders is growing that classical technical analysis in its pure form does not work anymore. Think for yourself, all the main books on the technical...

Mastering the Intricacies of Short-Term Trading Analysis

In the bustling corridors of the financial world, short-term trading stands out as a high-octane race, demanding lightning-fast reflexes, unwavering focus, and an adept understanding of market nuances...

ADX: Find the Strong Trend

In a wide variety of indicators that provide different signals, it's almost impossible to find the one that defines the trend's strength. It's vital to know whether the trend is stable or not, especially during...

What Are Order Blocks In Forex? Unraveling the Impact of Big Market Players

In the vast and intricate world of Forex trading, the presence of order blocks plays a crucial role in shaping market dynamics. Introduced by large financial institutions and central banks...

What Is Crypto On-Chain Analysis? Definition & Meaning

Blockchain transaction data is publicly available, creating possibilities for data science and machine learning. All trading and investment activity can be extracted from the public...

The role of a technical analyst

Forex traders use technical analysis to forecast future price movements of financial assets based on historical market data. It involves analysing trends, patterns...

Read the markets: Technical & Fundamental analysis

One of the biggest concepts in trading relates to Market Analysis and how to read the markets. This includes both Fundamental analysis and Technical analysis...

Three technical indicators you should know about

Seeing a list of indicators, you might easily get lost. This article will help you learn about 3 essential indicators that will help you define your trading strategy for any time period...

Mastering The 50-Day Moving Average And Its Applications in 2023

In the ever-evolving realm of financial markets, gaining a deep understanding of various tools and indicators is essential for deciphering price trends and making informed decisions...

T4Trade: Technical Analysis Techniques

Technical analysis techniques are vital for making informed trading decisions and to reduce the risk of large capital losses. In this article, we explore some of the most popular techniques and tools used by traders worldwide...

FP Markets information and reviews
FP Markets
81%
IronFX information and reviews
IronFX
77%
T4Trade information and reviews
T4Trade
76%
Exness information and reviews
Exness
76%
Just2Trade information and reviews
Just2Trade
76%
FXNovus information and reviews
FXNovus
75%

© 2006-2025 Forex-Ratings.com

The usage of this website constitutes acceptance of the following legal information.
Any contracts of financial instruments offered to conclude bear high risks and may result in the full loss of the deposited funds. Prior to making transactions one should get acquainted with the risks to which they relate. All the information featured on the website (reviews, brokers' news, comments, analysis, quotes, forecasts or other information materials provided by Forex Ratings, as well as information provided by the partners), including graphical information about the forex companies, brokers and dealing desks, is intended solely for informational purposes, is not a means of advertising them, and doesn't imply direct instructions for investing. Forex Ratings shall not be liable for any loss, including unlimited loss of funds, which may arise directly or indirectly from the usage of this information. The editorial staff of the website does not bear any responsibility whatsoever for the content of the comments or reviews made by the site users about the forex companies. The entire responsibility for the contents rests with the commentators. Reprint of the materials is available only with the permission of the editorial staff.
We use cookies to improve your experience and to make your stay with us more comfortable. By using Forex-Ratings.com website you agree to the cookies policy.