HFM information and reviews
HFM
96%
FXCC information and reviews
FXCC
92%
FxPro information and reviews
FxPro
89%
FBS information and reviews
FBS
88%
XM information and reviews
XM
86%
Exness information and reviews
Exness
86%

XPro Markets - Boost your Technical Analysis Skills


What is your angle when trading in the financial markets? Do you opt for the technical analysis strategy or are you a "fundamentalist" when it comes to trading? To be in a better position to control your trades, it’s important to keep improving both your technical analysis and your fundamental analysis skills. This can give you a more holistic picture of the markets and eventually give you the edge you need to seize the moment.

If you continue reading below, this article will offer you a better understanding of technical analysis and the benefits of implementing it into your trading strategies.

What is Technical Analysis?

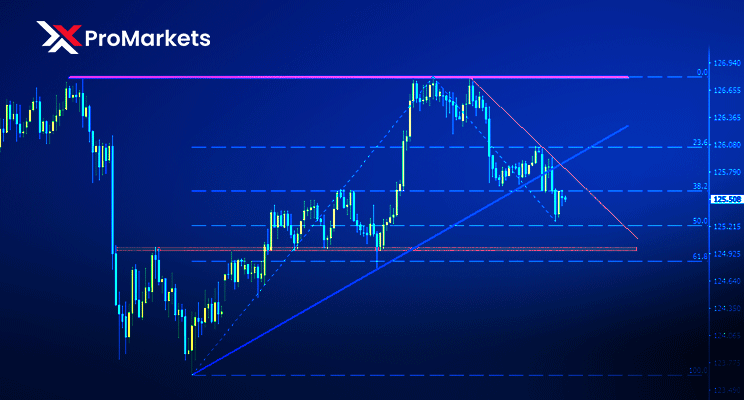
In technical analysis, price patterns and trends are observed on charts to evaluate investments and identify trading opportunities. Technical analysts monitor past trading activity and price changes and utilize them as effective indicators of a security's future price. In other words, this type of analysis is all about looking closely at charts and price movements with the aim to have a better picture of what is to come in the future.

XPro Markets - Boost your Technical Analysis Skills

Technical VS Fundamental Analysis

The basic principle that will help you remember the difference between these two main schools of thought when it comes to trading analysis is that one analyzes data and the other analyzes the news. Technical analysis looks at data gathered from price movements and trends of CFDs in an attempt to predict future price movements.

On the other hand, fundamental analysis focuses on economic news and market updates that impact your assets. Every economic event has the power to change the market overview.

This is why traders need to stay up to date with everything that has to do with the global economy because this can help them think out their next move more easily and effectively.

Basic Technical Analysis Indicators

Technical analysis trading can be supported by a wide range of patterns and signals developed through research. Various types of trading systems have also been developed by technical analysts to help them forecast price movements. There are many indicators available for identifying current market trends, including support and resistance areas, as well as those that assess the strength and longevity of a trend.

The following are some of the most common technical indicators and chart patterns: Trendlines, Channels, Momentum Indicators, and Moving Averages.

Level up your Trades

Want to build your ultimate trading strategy? Focus on combining technical and fundamental analysis so you can increase your confidence in the markets. Your XPro Markets account grants you access to Trading Central’s cutting-edge technical indicators and your real-time economic calendar to keep track of your trades. Log in now to find out more!

Risk Warning: Contracts for Difference (‘CFDs’) are complex financial products, with speculative character, the trading of which involves significant risks of loss of capital. 
Disclaimer: This material is considered a marketing communication and does not contain, and should not be construed as containing investing advice or a recommendation, or an offer of or solicitation for any transactions in financial instruments or a guarantee or a prediction of future performance. Past performance is not a guarantee of or prediction of future performance.

#source


RELATED

Types of analysis when trading in financial markets

It is well known that trading in the financial markets is one of the most dynamic and effective ways to make a profit, even in the absence of significant initial capital...

What Is MACD Indicator and How It Works?

The Moving Average Convergence Divergence (MACD) is a technical indicator that measures a relationship between two exponential moving averages...

Choosing a Trading Instrument: How to Trade Indices

By now, you must be familiar with the names of the world's major stock indices: Dow Jones, S&P 500, NASDAQ, DAX30. But did you know that they...

CFD Trading Simplified: Strategies for the Modern Online Trader

What if you could trade the global markets with more flexibility than ever before? With CFD trading, you can! Contracts for Difference (CFDs) stand out as powerful instruments within the Forex markets, providing the possibility to capitalize...

The US Dollar Index Chart. What is it, and how do you use it?

Many traders use indices in their trading. The stock market offers a huge variety of indices such as the S&P 500, NASDAQ, Dow Jones, etc. They provide a picture...

Mastering the Intricacies of Short-Term Trading Analysis

In the bustling corridors of the financial world, short-term trading stands out as a high-octane race, demanding lightning-fast reflexes, unwavering focus, and an adept understanding of market nuances...

Ascending Triangle Pattern in Trading

Investors tend to use different tools to define market direction - technical indicators, candlestick, and chart patterns are all key to successful trading. There is a wide...

Key Economic Indicators And How To Use Them In Forex Trading

Financial markets as well as the economy of any country in general are not static. It experiences periods of growth and decline, which together make up economic cycles...

What Is Crypto On-Chain Analysis? Definition & Meaning

Blockchain transaction data is publicly available, creating possibilities for data science and machine learning. All trading and investment activity can be extracted from the public...

Support and Resistance Levels: Comprehensive Overview and Practical Approaches

Support and resistance levels are paramount concepts, pivotal in navigating Forex and various financial markets. These levels underpin myriad trading strategies and form the foundational framework...

Decoding Volume: Exploring Volume Spread Analysis (VSA) In Forex Trading

In the world of forex trading, understanding the dynamics of supply and demand is paramount for success. Volume Spread Analysis (VSA) is a unique market analysis method...

FTSE 100 Predictions for 2021 and Beyond

Stock market returns in 2020 were eerily similar to what happened in 2009. We're seeing some strength emerging from a deep stock market recession. Even though...

Newbies' Guide To Technical And Fundamental Analysis

The most important goal of every trader is to make a profit by investing in various assets and trading instruments. Successful investors make in-depth, extensive research...

Support and resistance indicators: how to trade S&R in Forex

Support and resistance levels are one of the most important concepts in Forex trading. Many technical tools rely on support and resistance lines to find or to confirm trade setups...

Japanese Candlestick Chart Analysis

The most convenient option for charting any asset on Forex is Japanese candles. The information content and the state of the market's data...

Price Gaps In Forex Trading: Types, Causes, And Strategies

Price gaps are a common phenomenon in forex trading, characterized by a significant difference between the closing and opening prices of an asset...

A matrix to understand the Gold market

US investment bank Morgan Stanley produced a research note yesterday detailing that they see a period where real US bond yields rise in the near-term...

Mastering The 50-Day Moving Average And Its Applications in 2023

In the ever-evolving realm of financial markets, gaining a deep understanding of various tools and indicators is essential for deciphering price trends and making informed decisions...

Three technical indicators you should know about

Seeing a list of indicators, you might easily get lost. This article will help you learn about 3 essential indicators that will help you define your trading strategy for any time period...

What is technical analysis?

Technical analysis in one of the most widely used methods of forecasting price movements. The basis behind this type of analysis is the supposition that on the market...

FP Markets information and reviews
FP Markets
81%
IronFX information and reviews
IronFX
77%
AMarkets information and reviews
AMarkets
76%
Just2Trade information and reviews
Just2Trade
76%
FXNovus information and reviews
FXNovus
75%
T4Trade information and reviews
T4Trade
75%

© 2006-2025 Forex-Ratings.com

The usage of this website constitutes acceptance of the following legal information.
Any contracts of financial instruments offered to conclude bear high risks and may result in the full loss of the deposited funds. Prior to making transactions one should get acquainted with the risks to which they relate. All the information featured on the website (reviews, brokers' news, comments, analysis, quotes, forecasts or other information materials provided by Forex Ratings, as well as information provided by the partners), including graphical information about the forex companies, brokers and dealing desks, is intended solely for informational purposes, is not a means of advertising them, and doesn't imply direct instructions for investing. Forex Ratings shall not be liable for any loss, including unlimited loss of funds, which may arise directly or indirectly from the usage of this information. The editorial staff of the website does not bear any responsibility whatsoever for the content of the comments or reviews made by the site users about the forex companies. The entire responsibility for the contents rests with the commentators. Reprint of the materials is available only with the permission of the editorial staff.
We use cookies to improve your experience and to make your stay with us more comfortable. By using Forex-Ratings.com website you agree to the cookies policy.