HFM information and reviews
HFM
96%
FXCC information and reviews
FXCC
92%
FxPro information and reviews
FxPro
89%
FBS information and reviews
FBS
88%
XM information and reviews
XM
86%
NordFX information and reviews
NordFX
86%

What Is the Risk/Reward Ratio and How to Use It


The risk/reward ratio tells you how much risk you are taking for how much potential reward. Good traders and investors choose their bets very carefully. They look for the highest potential upside with the lowest potential downside. If an investment can bring the same yield as another, but with less risk, it may be a better bet. Whether you’re day trading or swing trading, there are a few fundamental concepts about risk that you should understand.

These form the basis of your understanding of the market and give you a foundation to guide your trading activities and investment decisions. Otherwise, you won’t be able to protect and grow your trading account.

Interested to learn how to calculate this for yourself? Let’s read on.

What is the risk/reward ratio?

The risk/reward ratio marks the prospective reward an investor can earn for every dollar they risk on an investment. Many investors use risk/reward ratios to compare the expected returns of an investment with the amount of risk they must undertake to earn these returns. Consider the following example: an investment with a risk-reward ratio of 1:7 suggests that an investor is willing to risk $1, for the prospect of earning $7. Alternatively, a risk/reward ratio of 1:3 signals that an investor should expect to invest $1, for the prospect of earning $3 on their investment.

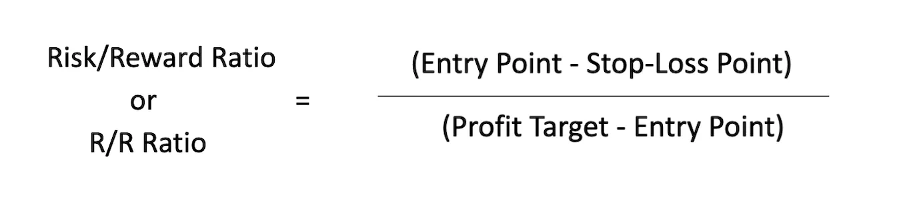
The calculation itself is very simple. You divide your maximum risk by your net target profit. How do you do that? First, you look at where you would want to enter the trade. Then, you decide where you would take profits (if the trade is successful), and where you would put your stop-loss (if it’s a losing trade). This is crucial if you want to manage your risk properly. Good traders set their profit targets and stop-loss before entering a trade.

Now you’ve got both your entry and exit targets, which means you can calculate your risk/reward ratio. You do that by dividing your potential risk by your potential reward. The lower the ratio is, the more potential reward you’re getting per “unit” of risk. Let’s see how it works in practice. It’s worth noting that many traders do this calculation in reverse, calculating the reward/risk ratio instead. Why? Well, it’s just a matter of preference. Some find this easier to understand. The calculation is just the opposite of the risk/reward ratio formula. As such, our reward/risk ratio in the example above would be 15/5 = 3. As you’d expect, a high reward/risk ratio is better than a low reward/risk ratio.

Limitations of the Risk/Reward Ratio

A low risk/reward ratio does not tell you everything you need to know about a trade. You also need to know the likelihood of reaching those targets. A common mistake for day traders is having a certain R/R ratio in mind before analyzing a trade. This can lead traders to establish their stop-loss and profit targets based on the entry point, rather than the value of the security, without taking into account the market conditions surrounding that trade.

Choosing the best risk/reward ratios is a balancing act between taking trades that offer more profit than risk while ensuring the trade still has a reasonable chance of reaching the target before the stop loss.

What Is the Risk/Reward Ratio and How to Use It

What Does the Risk/Reward Ratio Tell You?

The risk/reward ratio helps investors manage their risk of losing money on trades. Even if a trader has some profitable trades, they will lose money over time if their win rate is below 50%. The risk/reward ratio measures the difference between a trade entry point to a stop-loss and a sell or take-profit order. Comparing these two provides the ratio of profit to loss, or reward to risk.

Investors often use stop-loss orders when trading individual stocks to help minimize losses and directly manage their investments with a risk/reward focus. A stop-loss order is a trading trigger placed on a stock that automates the selling of the stock from a portfolio if the stock reaches a specified low. Investors can automatically set stop-loss orders through brokerage accounts and typically do not require exorbitant additional trading costs.

Conclusion

We’ve looked at what the risk/reward ratio is and how traders can incorporate it into their trading plan. Calculating the risk/reward ratio is essential when it comes to the risk profile of any money management strategy. What’s also worth considering when it comes to risk is keeping a trading journal. By documenting your trades, you can get a more accurate picture of the performance of your strategies. In addition, you can potentially adapt them to different market environments and asset classes.

#source


RELATED

Technical analysis: what separates the pros from the schmoes

In essence, technical analysis hinges on the study of past price movements and trends to predict future market developments. It first emerged as a tradition...

A Pullback: Trade Against a Trend

Reading analytical outlooks on the price movements, you might be met with the word “pullback”. Many trading strategies are based on a pullback action...

What is Fundamental Analysis?

Understanding the core of an activity always makes it easier to do it regardless of how complicated it is. That is the case with fundamental analysis. While it may be done through...

How to Use the US Dollar Index (DXY) in Trading

The US Dollar is the most traded currency in the world. It is used as a currency of the majority of international transactions while also being part of the most popular currency pairs on the Forex market...

Leverage and Margin in Forex

Leverage and margin are the terms each trader starts with. The concept is simple, so even a beginner trader will catch on fast. However, there are pitfalls that may affect traders...

Depth Of The Market: Definition And Meaning

Depth of the Market is a special technical indicator developed for the MetaTrader 4 terminal. It is designed to monitor the current price movement and also to determine the supply and demand zones...

Japanese Candlestick Chart Analysis

The most convenient option for charting any asset on Forex is Japanese candles. The information content and the state of the market's data...

Currency Strength Meter: Complete Guide

Any trader needs to define the direction of the currency pair. It is also important to remember that the market movement is defined by the strength and weakness...

Ascending Triangle Pattern in Trading

Investors tend to use different tools to define market direction - technical indicators, candlestick, and chart patterns are all key to successful trading. There is a wide...

Elliott Waves for Forex Market Analysis

Studying the Forex market, it is easy to notice that the price movement on it occurs in waves. For decades many traders have been trying to find...

Moving averages explained

Learn how to trade with one of the most popular Forex indicators - Moving Averages. In this article, we explain how to use moving averages as a technical analysis...

Types of analysis when trading in financial markets

It is well known that trading in the financial markets is one of the most dynamic and effective ways to make a profit, even in the absence of significant initial capital...

How to take your Forex trading to the next level

The Forex market is one of the most volatile and lucrative markets in the trading landscape. Worth an absolutely unfathomable $6.5+ trillion a day, it dwarfs...

Stop Orders Demystified: A Comprehensive Examination

In the intricate tapestry of financial markets, an arsenal of tools and techniques awaits traders and investors. Among these, trading orders serve as the backbone of any robust trading strategy...

FTSE 100 Predictions for 2021 and Beyond

Stock market returns in 2020 were eerily similar to what happened in 2009. We're seeing some strength emerging from a deep stock market recession. Even though...

Bull Flag Pattern in Trading - Open Long Trades

In the world of technical indicators and patterns, finding a reliable, workable tool that would help you predict price direction is challenging. However, they exist...

Art of Trend Analysis Revealed: Strategies and Types

In the intricate world of financial markets, understanding trends is akin to deciphering a vital code. Trends act as a compass, guiding the trajectory of asset prices and heavily influencing trading decisions...

Awesome Oscillator: Strategies & Uses

The awesome oscillator is a market momentum indicator that is used to define reversals and corrections of the price. It's one of the easiest but most effective trading tools...

A Comprehensive Guide to Technical Analysis: Definition, Tools & Examples

Technical Analysis is a systematized approach employed by traders to predict price movements and trends by examining market data, primarily price and volume...

Unlocking the Power of Technical Analysis in Trading

Technical analysis, often regarded as a cryptic endeavor for newcomers to the world of capital markets, is an essential tool for traders and investors seeking insights...

Vantage information and reviews
Vantage
85%
FP Markets information and reviews
FP Markets
81%
IronFX information and reviews
IronFX
77%
T4Trade information and reviews
T4Trade
76%
Exness information and reviews
Exness
76%
Just2Trade information and reviews
Just2Trade
76%

© 2006-2025 Forex-Ratings.com

The usage of this website constitutes acceptance of the following legal information.
Any contracts of financial instruments offered to conclude bear high risks and may result in the full loss of the deposited funds. Prior to making transactions one should get acquainted with the risks to which they relate. All the information featured on the website (reviews, brokers' news, comments, analysis, quotes, forecasts or other information materials provided by Forex Ratings, as well as information provided by the partners), including graphical information about the forex companies, brokers and dealing desks, is intended solely for informational purposes, is not a means of advertising them, and doesn't imply direct instructions for investing. Forex Ratings shall not be liable for any loss, including unlimited loss of funds, which may arise directly or indirectly from the usage of this information. The editorial staff of the website does not bear any responsibility whatsoever for the content of the comments or reviews made by the site users about the forex companies. The entire responsibility for the contents rests with the commentators. Reprint of the materials is available only with the permission of the editorial staff.
We use cookies to improve your experience and to make your stay with us more comfortable. By using Forex-Ratings.com website you agree to the cookies policy.