


Trading Forex is a complex game that absorbs a lot of time and requires psychological endurance and vast knowledge of all aspects of the art of price prediction, particularly the ability to recognize the important candlestick patterns and act accordingly. The multitude of indicators that are available on all Forex trading platforms might help you refine an entry or an exit point, but everything still boils down to traders’ prowess as an interpreter of candlestick patterns. For this reason, we have compiled a list of the best candlestick patterns for Forex trading, the majority of which are the reversal ones, because only they will assist you in figuring out when it’s time to buy low and sell high.
The hammer and the hanging man - the combination of simplicity and efficiency
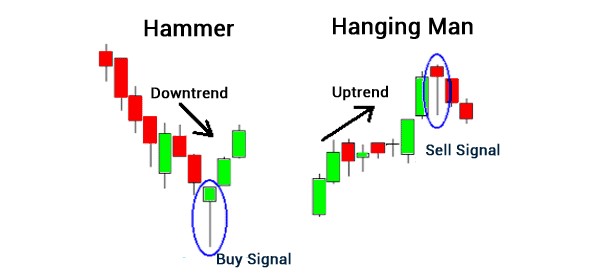
Both the hammer and the hanging man are probably the most basic, but at the same time, the most efficient candlestick patterns to trade Forex with if your goal is to jump in a trade when the market is about to reverse. That is why they belong to the category of one-candlestick reversal patterns. The hammer is the bullish pattern that appears at the bottom of the trend after a substantial price decline, whereas the hanging man is a bearish pattern that can be seen at the top of the uptrend. Both these patterns are tradable on any time frame higher than 15M.
The ability to recognize and trade off these patterns is invaluable for any successful Forex trader because they hint at the probable top, or the probable bottom, of a trend and signal that traders should start looking for the most optimal exit or entry points.
Source: hlc.edu.in
The hammer pattern emerges when a currency price drop substantially lower than the opening price of the day, but then the buyers step in and drive the price back to the level near the day’s open, thus forming the one-candlestick pattern with a large lower wick (shadow), a relatively small real body at the absence, or a very small, upper wick. The color of the real body doesn’t bear much significance - it can be red (black) at the bottom of the downtrend or green (white) at the top of an uptrend. Certainly, a green body of a candlestick that flags the possible trend reversal might look more reassuring, but in reality, there have been many strong uptrends that stemmed from the hammer with the red body.
It’s important to know that the proper hammer pattern should have the lower wick at least twice as large as the candle’s real body; otherwise, that Forex candlestick pattern must be deemed as neutral. Also, remember that the real body of either a hammer or a hanging man must stay close or be within the upper (lower) price range.
When this formation appears, traders say that the market is hammering out, and the reversal could be in the making. But the real essence of this candlestick pattern is best described by its Japanese name, “takuri”, which can be roughly translated as “testing the depth of the water by trying to reach for the bottom with a leg,” which makes a lot of sense when you look at its structure.
The rule of thumb for using both these patterns is quite simple: the strength, or the reliability, of a hammer or a hanging man depends on the length of the lower wick, the size of the real body, and the presence of the absence of an upper wick and its size. The most meaningful patterns have a very long lower wick, small bodies, up to the point where they look like a dragonfly doji, and a very little or no upper wick.
There is another hint regarding this pattern that we’d like to share with you: when the hanging man appears at the presumed top of the uptrend, don’t rush into selling your position because the market is still running on the bullish steam, especially if the price movement is supported by the increasing volume, and there is a good chance that it would eat up the hanging man and continue pushing northward. Instead, wait for the next session to see whether the Forex market opens lower than the previous day’s close. If that’s the case and the price drops with a considerable gap, the viability of the hanging man increases dramatically, and you can consider going short on that particular Forex pair.
Shooting star and inverted hammer point at the exit/entry points
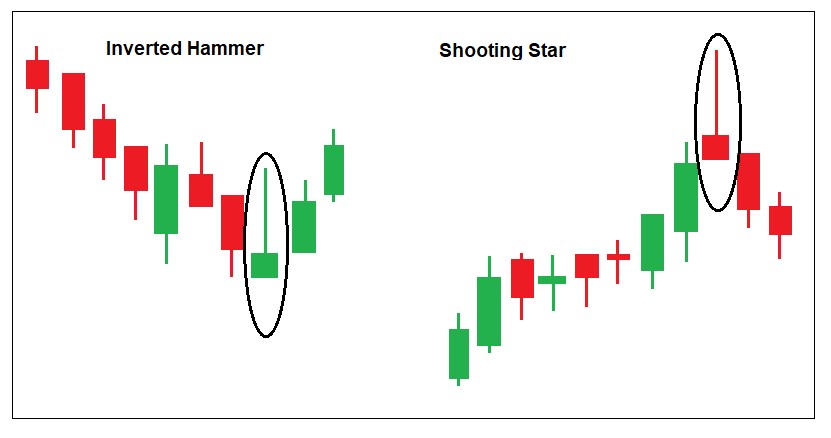
A shooting star and an inverted hammer are basically a hanging man and a hammer turned upside down that also act as the reversal patterns that emerge at the probable finale of a strong trending movement. The pattern is formed when the price of the particular Forex pair opens slightly above the close of the previous day, rallies strongly at first, but then gets pressurized by the sellers almost to the open of the trading session, thus forming the pattern with a long upper shadow, a small body, and little to no lower shadow. Please remember that the shooting star pattern can be considered as tradable only in trending markets, especially during powerful rallies, or at the top of the congestion zone. A shooting star and an inverted hammer in the ranging market has little to no significance with regard to forecasting the upcoming price movement.
Source: Pinterest
An inverted hammer, on the other hand, appears at the potential bottom of a downtrend and indicates that the buyers are seizing the initiative, and the price action might start going in the opposite direction. Both these patterns indicate that the market participants couldn’t sustain the rally or the downslide.
The most solid shooting star is the one that appears after the price opens with a gap from the real body of the previous candle and has a visible, but not too large, body, which differentiates it from the gravestone doji, which is considered a much weaker trading pattern that requires additional confirmation, like the extraordinarily high trading volume during the session when the pattern had surfaced.
However, as with any other individual Forex candlestick pattern, it is highly advisable to exercise patience and wait until the market reacts during the following trading session, whether it’s on an hourly or a daily time frame. If the price starts moving in the direction opposite to the trend, preferably with a gap at the session’s open, the probability of a full-fledged reversal increases substantially. Also, when trading the shooting star pattern, you can get the confirmation by means of momentum indicators, such as MACD or RSI, which come very handy when determining when the shift of power takes place within the market. If the shooting star pops up when RSI, for instance, is deep in the overbought area (above 80), consider going for a sell or entering a short position. Moreover, when there is a divergence shown by any of these indicators (a discrepancy between the direction of the price action and the movement of indicators’ moving averages), the shooting star pattern at the top of the price swing would constitute a mighty strong sell signal.
As for the inverted hammer, it has a similar confirmation scheme: the gap to the upside on the back of the growing bullish momentum and rising price, but here it’s important to take into account the color of the real body and the time during which the price holds above the hammer’s body and within the upper wick - the shorter it is, the higher is the probability that the reversal will pan out.
Bearish and bullish engulfing patterns as signs of a major reversal
A shooting star, the hammers, and a hanging man are the only individual (single) candlestick patterns that matter in Forex trading - there are at least four types of doji patterns: the common, the long-legged, and gravestone, and the dragonfly dojis, but they work only in combination with confirmatory factors. Whereas the best Forex candlestick patterns come in the combination of two or more candlesticks, with engulfing patterns being probably the most easily determinable and arguably the most reliable Forex trading signals, if confirmed by the abnormally high trading volume or the showings of various indicators.
Source: Pinterest
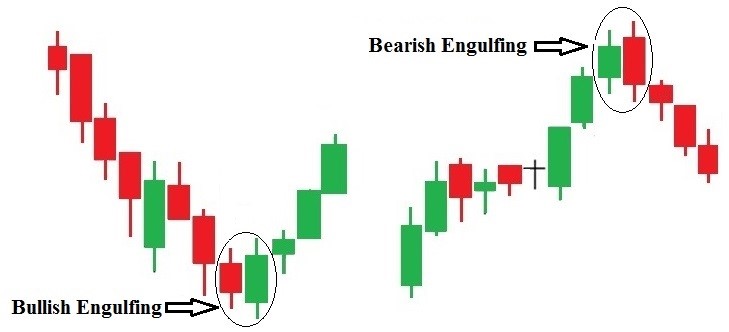
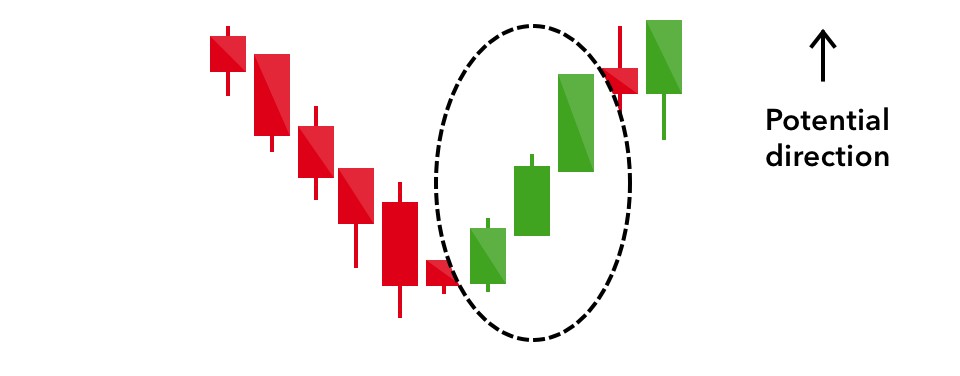
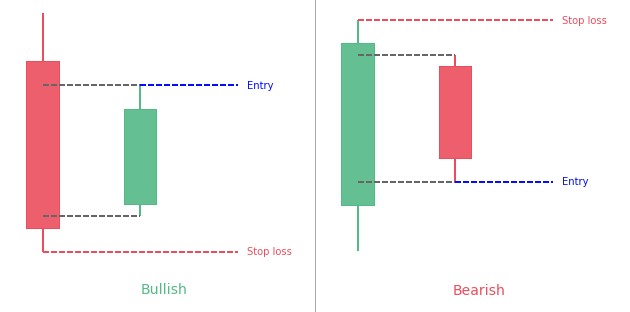
As already said, identifying the engulfing pattern isn’t problematic at all: just look for a green candle (in case of the bullish engulfing) that appears at the bottom of the downtrend and “eats up” the entire space made by either one or better two previous bearish candles. Please mind that a proper bullish engulfing pattern sees the explosive green candle opening lower than the close of the preceding red candle and closing higher than that candle’s open, hence completely overlapping the price action during the previous one or two trading sessions. Note that the more bearish candlesticks form before the buyers decide to push back, the more meaningful the bullish engulfing pattern becomes. Ideally, there should be no less than four successive red candles before the reversal attempt is made for this pattern to be considered reliable.
The same rule applies to the bearish reversal pattern, but in that case, there should be at least three green candles before the bears start to apply the pressure. Remember that it’s mandatory for the engulfing candle to be of the opposite color of the preceding candle, except when the previous candle is a neutral doji, and to have a gap upward or downward before the actual engulfing occurs or it can’t be considered as an engulfing pattern. Also, keep in mind that the engulfing candle mustn’t have long upper or lower shadows, though the small wicks in either direction are acceptable.
The absence of an upper wick on the bullish engulfing candle increases the likelihood of the price moving up during the next trading session and close above the overall pattern structure. The larger is the difference between the size of the real body of the last bearish (bullish) candle and the one that absorbs it, the stronger is the pattern itself, and the higher is the likelihood of trend reversal. Lastly, if the move to the upside or the downside happens on the backdrop of a soaring trading volume, there is probably a very significant change in the underlying sentiment that will force the reversal. The course of action upon the emergence of this pattern must depend on your Forex trading style: an aggressive trader would prefer to go long or short at the close of the “engulfing” trading session, while a conservative Forex speculator would prefer to wait for the confirmation via the next candle.
Keep in mind that this is not a universal trading pattern as it’s most suitable for markets with clear-cut trends, whereas the erratic price action, even if the general trend remains intact, diminishes the significance of engulfing patterns. Plus, if the engulfing candle is far too big, Forex traders would have a difficult time determining the right level for a stop loss because the risk that the price action would roll back remains too great, at least until the next trading session.
Three black crows - the harbingers of the uptrend’s doom
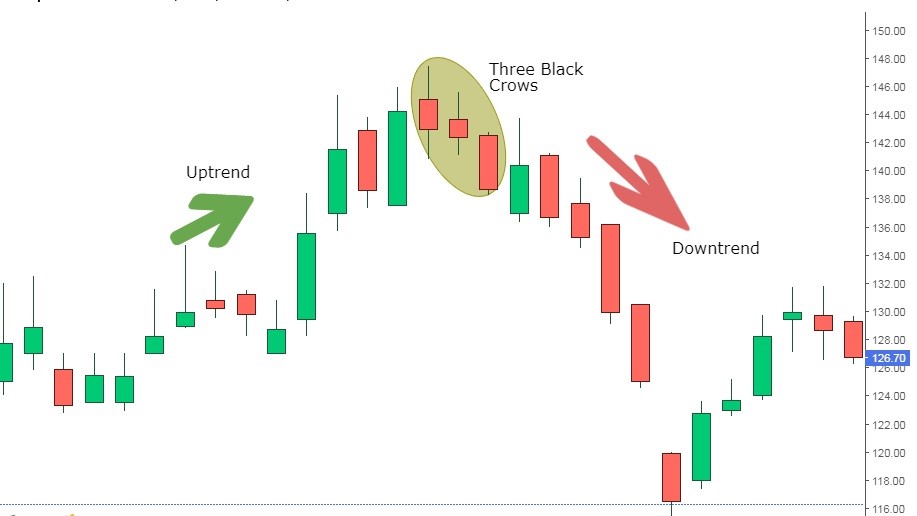
Three black crows create the bearish reversal pattern that has the appearance of three consecutive bearish candles that take shape at the top of a powerful rally and signal that the bull might have run out of puff and the bears are seizing the initiative up to the point when they receive total control over the market, and the downtrend commences.
Source: Investing.com
This bearish pattern is easily identifiable on any time frame, though keep in mind that it works best on time frames higher than 30M. However, it’s not enough to find three successive bearish candles and label them as those ominous crows. For the three black crows to be viable, the pattern has to start below the high of the bullish candle that ended the rally, while all three candles must have large real bodies with little to no upper or lower shadows.
It’s also important to know that the real body of the second and the third candle in that pattern must open within the confines of the preceding candle’s body, while also closing much lower than the close of the previous candle without long wicks.
The larger are the candles, the more significant is the bearish pressure, and the higher is the probability of full-fledged reversal. It’s also important for all three candles to be roughly the same size that would signify the determination of sellers to drive the price to the lower levels and disrupt the uptrend structure.
The short real body of the last bearish candle could be the sign that the potential reversal might actually be a retracement, and the uptrend would persist. There is also a variation of this pattern called the identical three crows that occurs when the second and the third red candles open in close proximity to the close of the first candle. It’s a kind of bearish reversal pattern that you won’t see too often in Forex markets, but it’s generally regarded as one of the strongest bearish dual candlestick patterns out there, especially if it receives the confirmation from the indicators such as RSI that the bearish momentum is mustering strength. Unlike previously described patterns, three black crows provide a good trading signal not only in trending markets but also when the price consolidation is running its course, so, in a way, it can be perceived as both the reversal and the breakout pattern, a hybrid of sorts.
Three white soldiers are pushing the price uphill
Three white soldiers, also sometimes referred to as three advancing soldiers, is the bullish reversal pattern that manifests itself at the very bottom of a downtrend and shows that the buyers are determined to turn the tide of the war. As you might have already figured out, three white soldiers is a mirror reflection of the previous pattern, three black crows, so the rules for identifying this candlestick combination is practically the same:
- There should be three consecutive bullish candles, with the second and the third candles opening within the body of a previous candle;
- The candles have to be of approximately the same size with little wicks - it’s better if there are no wicks at all, but that’s a rare sight in Forex.
Source: IG.com
But this particular pattern is a tricky one as it offers a lot of nuances that must be taken into consideration when taking a position on the basis of this candlestick formation. First off, you need to pay attention to the size of the candles and the prior levels of support and resistance, as well as suppress the desire to jump in the trade once the market starts pushing aggressively to the upside. Remember that oftentimes, this bullish reversal pattern turns out to be a fluke if not confirmed by other indicators.
Also, make sure to always wait until the close of the final candlestick of this Forex pattern, because the first two good-looking bullish candles are often followed by a faulty third candle that leads either to the advance block or the stalled pattern, which might ultimately translate to the continuation of the bearish trend. The stalled pattern is especially dangerous when the last bullish candle is riding on the shoulders of the previous one and has a small real body that makes it look like a star pattern. It often means that the buyers’ power has deteriorated, along with the probability of the reversal. Be very cautious of the candlestick pattern that emerges after the soldiers - refrain from going long or adding to the existing position if something like a hanging man presents itself after the pattern got blocked or stalled as this usually leads to a considerable price degradation.
When the dark cloud covers that bullish party
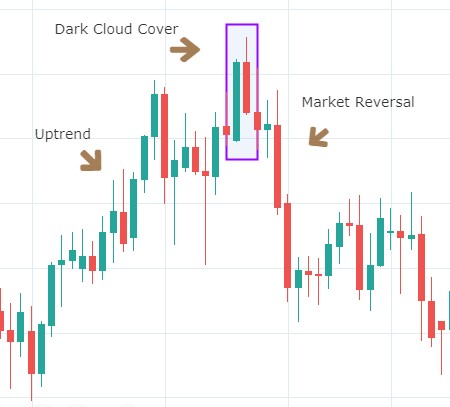
This one is another bearish reversal pattern that a consistently profitable Forex trader has to recognize and act upon in order to avoid losing money once the uptrend reverses while he is in a long position, or prepare himself to go short on a currency pair if the pattern gets a legitimate confirmation.
Source: Tradingview
It’s a double candlestick pattern that is made of two large candles: one bullish and another one bearish. For the dark cloud cover to form, the second candle has to open above the close of the bullish candle, have the buyers drive the price to the upside a bit where they will meet a tough resistance from sellers, who will push the price back to the midpoint of the bullish candle.
Remember that both candles must have sufficiently large real bodies and short-to-middle-sized wicks - the smaller are the bodies, the less trustworthy is the pattern at hand. Also, the deeper is the penetration of the bearish candle into the body of the bullish one, the higher is the probability that this pattern would end up being the top of the uptrend.
But if the red candle fails to cover at least half of the green one, it would be wise to avoid making any moves at this point and wait for the bearish confirmation during the next trading session. If the bearish candle covers the entire body of the bullish one, and possibly more, then there is a chance that this pattern would ultimately transform into the bearish engulfing one, which is an even more meaningful bearish reversal pattern. Conversely, if the body of the green candle closes above the candle that forms the dark cover, there is a decent possibility that the bears are about to fail, and the rally would continue.
It’s also important to be considerate of the proximity of the dark cloud cover to the determined levels of support and resistance. For instance, if the “dark” candle opens above the major level of resistance but then proves to be unable to hold above it, this development will provide an extra confirmation that the buyers have lost their grip on the market, and the reversal is likely to follow.
Apart from that, always be mindful of the trading volume when considering taking a Forex trade on the basis of the dark cloud cover pattern. A very high trading volume during the session that forms the penetrating red candle could mean that there has been the so-called buying blow off as many Forex traders got caught up in the FOMO and boarded the plane right before the market sold off. At that point, they would probably attempt to cut the losses that would put additional selling pressure on the currency pair and result in a swifter downfall of the price. In this situation, a trader could go short near the close of the covering candle or after the confirmation from the next session’s candle, with the stop loss placed near the open of that candle.
Harami - the birth of trend reversal
Harami is translated from Japanese as “pregnant,” which makes sense if you look at this two-bar reversal candlestick pattern that consists of a large candlestick that is followed by a significantly smaller one that stays entirely within the real body of the preceding candle, so the entire pattern looks like a baby bump on a woman. The size of the wicks on both candles is of no particular importance.
Source: PatternWizard
In essence, the Harami pattern can be viewed as a reversed version of the engulfing one described above, but there is one significant difference between the two, which is the color of the real bodies. As you already know, the engulfing one is comprised of two candlesticks of the opposite color, whereas the harami pattern can be deemed as tradable even if the real bodies of both candles are of the same color, though the differently colored bodies indeed carry more weight.
Being the reversal pattern, harami forecasts that the ongoing trend is about to change direction. It must be noted that this particular pattern isn’t as distinctive in its reversal predicting capabilities as the engulfing pattern; therefore, it requires further confirmation coming from oscillators, moving averages, or trading volume. Harami doesn’t always hint at a sharp reversal of the previous trend - it rather shows that the market is about to enter the stalemate or take a pause before deciding on where to move next, though this pattern indeed dictates that the possibility of reversal is higher than that of trend continuation.
There are three types of harami patterns: the bullish harami, the bearish harami, and the harami cross. The first two patterns are pretty straightforward: each one appears at the top or the bottom of the trend to show that the market is entering a brief stage of uncertainty that may result in a trend reversal.
These patterns are usually confirmed by momentum oscillators such as RSI or Stochastic. For instance, the emergence of bearish harami on the backdrop of RSI being in the overbought zone significantly increases the chances of reversal, especially if it’s accompanied by the surging trading volume.
The harami cross differs from the usual harami only in the size of the “belly” - in the case of a cross pattern, it’s represented by a small doji that is located completely inside the “woman,” including the wicks. This pattern is illustrative of even more profound indecision in the market, so it’s of utmost importance to monitor the price action during the next couple of trading sessions in order to catch the drift and exit the position if the price reverses or enters it in the direction of the market. The harami cross gets greatly enhanced if it occurs near the levels of support or resistance and if the oscillators are in the overbought or the oversold territory.
Tower tops and tower bottoms
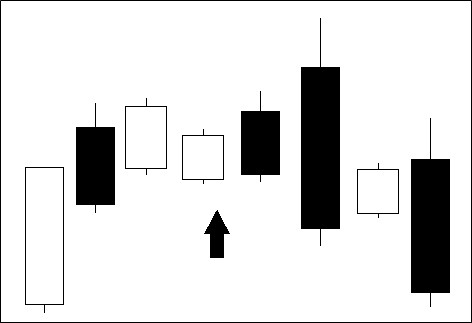
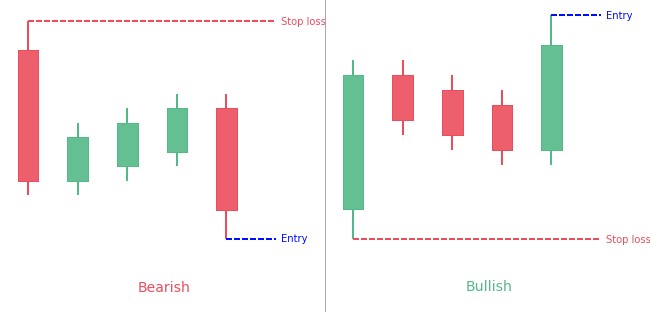
Let’s finalize the analysis of the best reversal patterns for trading Forex with a complex formation called the tower top (for the uptrend) and the tower bottom (for the downtrend). This pattern consists of as many as five candlesticks: two strong ones resemble the tower walls, the first one appears at the end of the previous trend, and the second one starts the reversal; the three other candlesticks that look like the toothy dome of the tower signify a short-term lull in the Forex market.
Tower top pattern. Source: Quora
The main requirement for this particular pattern is that the tower wall must have real bodies of approximately the same size and open and close at more or less the same price levels, not counting the wicks. Although it’s preferable if the candle that initiates the reversal closes slightly above the one that finalized the preceding trend. It comes to show that after two to three trading sessions where indecision was prevalent, the opposing side has tipped the scales in its favor and the market starts gearing up for the reversal. The pattern works the same way at the top of the uptrend and at the bottom of the downtrend.
This pattern can be easily confused with the dumpling top and the frying pan bottom, other popular Forex candlestick patterns that signal the potential trend reversal. The main difference between them is that the tower tops have much stronger side candlesticks, and much more volatile for that matter, whereas the dumpling top and frying pan bottom tend to have gaps or windows, while the tower walls usually engulf those three to five candlesticks that form the toothy dome. And like with most reversal patterns in Forex, it’s important to pay attention to the momentum indicators, though in that case, the Accumulation/Distribution indicator would also do a good service.
Rising three methods - hold onto your position for now
Trading Forex successfully implies not only recognizing the reversal patterns and acting on them accordingly, but also knowing when to calm your nerves and sit tight even when the price of a foreign currency is dropping over several consecutive trading sessions. It’s of utmost importance to distinguish the trend reversal from the retracement, upon which the price will keep on chugging in the previously established direction. And that’s when the Forex pattern called the rising three methods would come in handy.
Source: PatternWizard
This one is the bullish continuation pattern - the bearish one is called the falling three methods - that consists of five candlesticks (two bullish and three bearish), with the final one offering a confirmation that the buyers are still controlling the markets as the sellers have failed to push them out of a driving seat. The bullish candlesticks must have large real bodies; the first one must be big enough to accommodate the following three bearish candlesticks, all of which should fit into the real body of the initiating bullish one. If the first or the last bearish candlestick crawls above or below the open or the close of the bullish counterpart, the pattern will lose its significance.
The second bullish candlestick of this pattern must open higher than the close of the previous bearish session and close above the closing price of the first bullish candle. Conceptually, this pattern is very close to a bullish flag or pennant, but it’s more strictly structured and dynamic. Lastly, avoid trading the rising three methods if the pattern appears close to some important level of resistance because, at that junction, the trend might cork up and start ranging.


